Getting Started
Meter Statistics
What is Meter Statistics?
Meter Statistics is one of the 3 Dashboards included in Meter Analytics & Forensics, and provides insights from accumulated Meter Scan Data, specifically derived from Anyline’s Meter Modules:
-
Meter
-
Meter Serial Number
-
Barcode
Like the Meter Forensics, the Meter Statistics Dashboard also provides UCR Scan Data. In addition, it displays General Scan Data, Statistics, and Analytics.
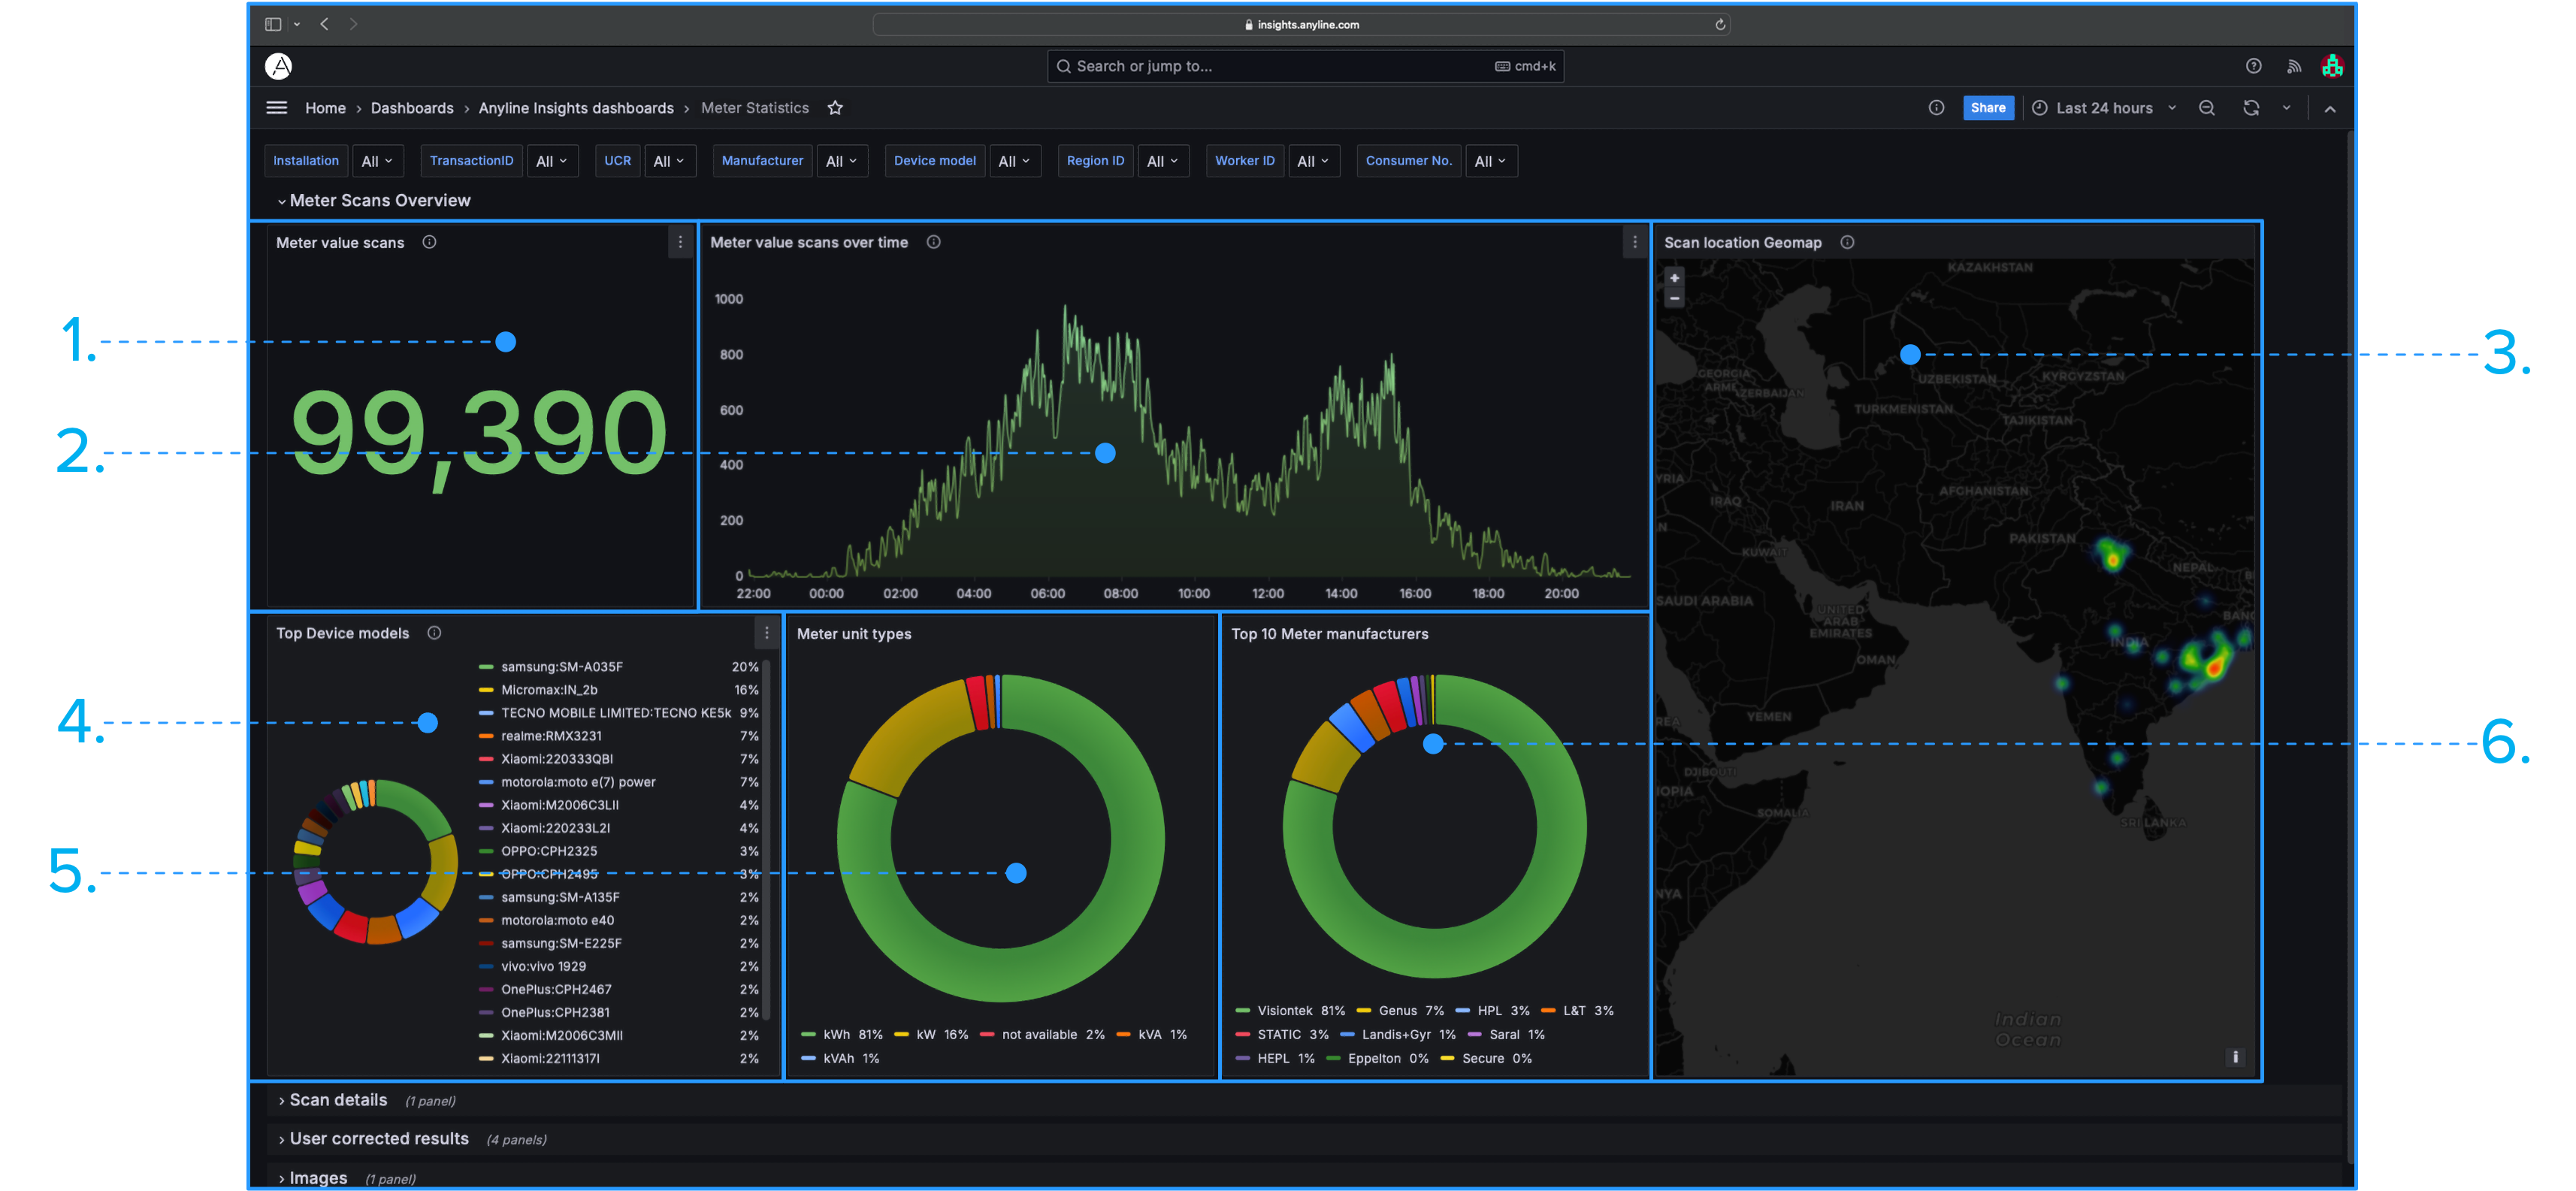
The Meter Scan Data is visually represented on a variety of Panels, including some Panels seen in other Dashboards, while also having others designed exclusively for Meter Statistics.
Dashboard
Meter Statistics has its own unique set of Filters and Panels along with some other Filters and Panels found on other Dashboards. The Data on this Dashboard’s Panels will vary based on the Filters you select.
|
As the Business Event Tracking Parameters (e.g., Worker ID, Region ID, Consumer Number, or a combination of these) displayed on this Dashboard are purely for demonstrative purposes to give you an idea of how your Dashboards can be configured, the actual combination of Filters and Panels present on your Dashboard may differ based on the Business Event Tracking Parameters provided. If you wish to enable these Filters and Panels please be sure to provide these Parameters, so they can be added to the Dashboard. Please reach out to your CSM for guidance on how to provide these Parameters. For more information on Business Event Tracking Parameters, please go to the Meter Analytics & Forensics Home Page. |
Meter Statistics Data Filter
|
The Filter Section of every Anyline Insights Dashboard contains both a Time/Date Range Filter and Data Filter. The Time/Date Range Filter contains the same features and options on every Dashboard from each Module and is mentioned on the Modules Home Page. |
The Data Filter in Meter Statistics has 8 options to choose from and filter your Meter Scan Data on the Dashboard. Here are the 8 Filters available on Meter Statistics.
|
|
| All Filters marked with (****) are Business Event Tracking Parameters. |

Meter Statistics Panel Filters
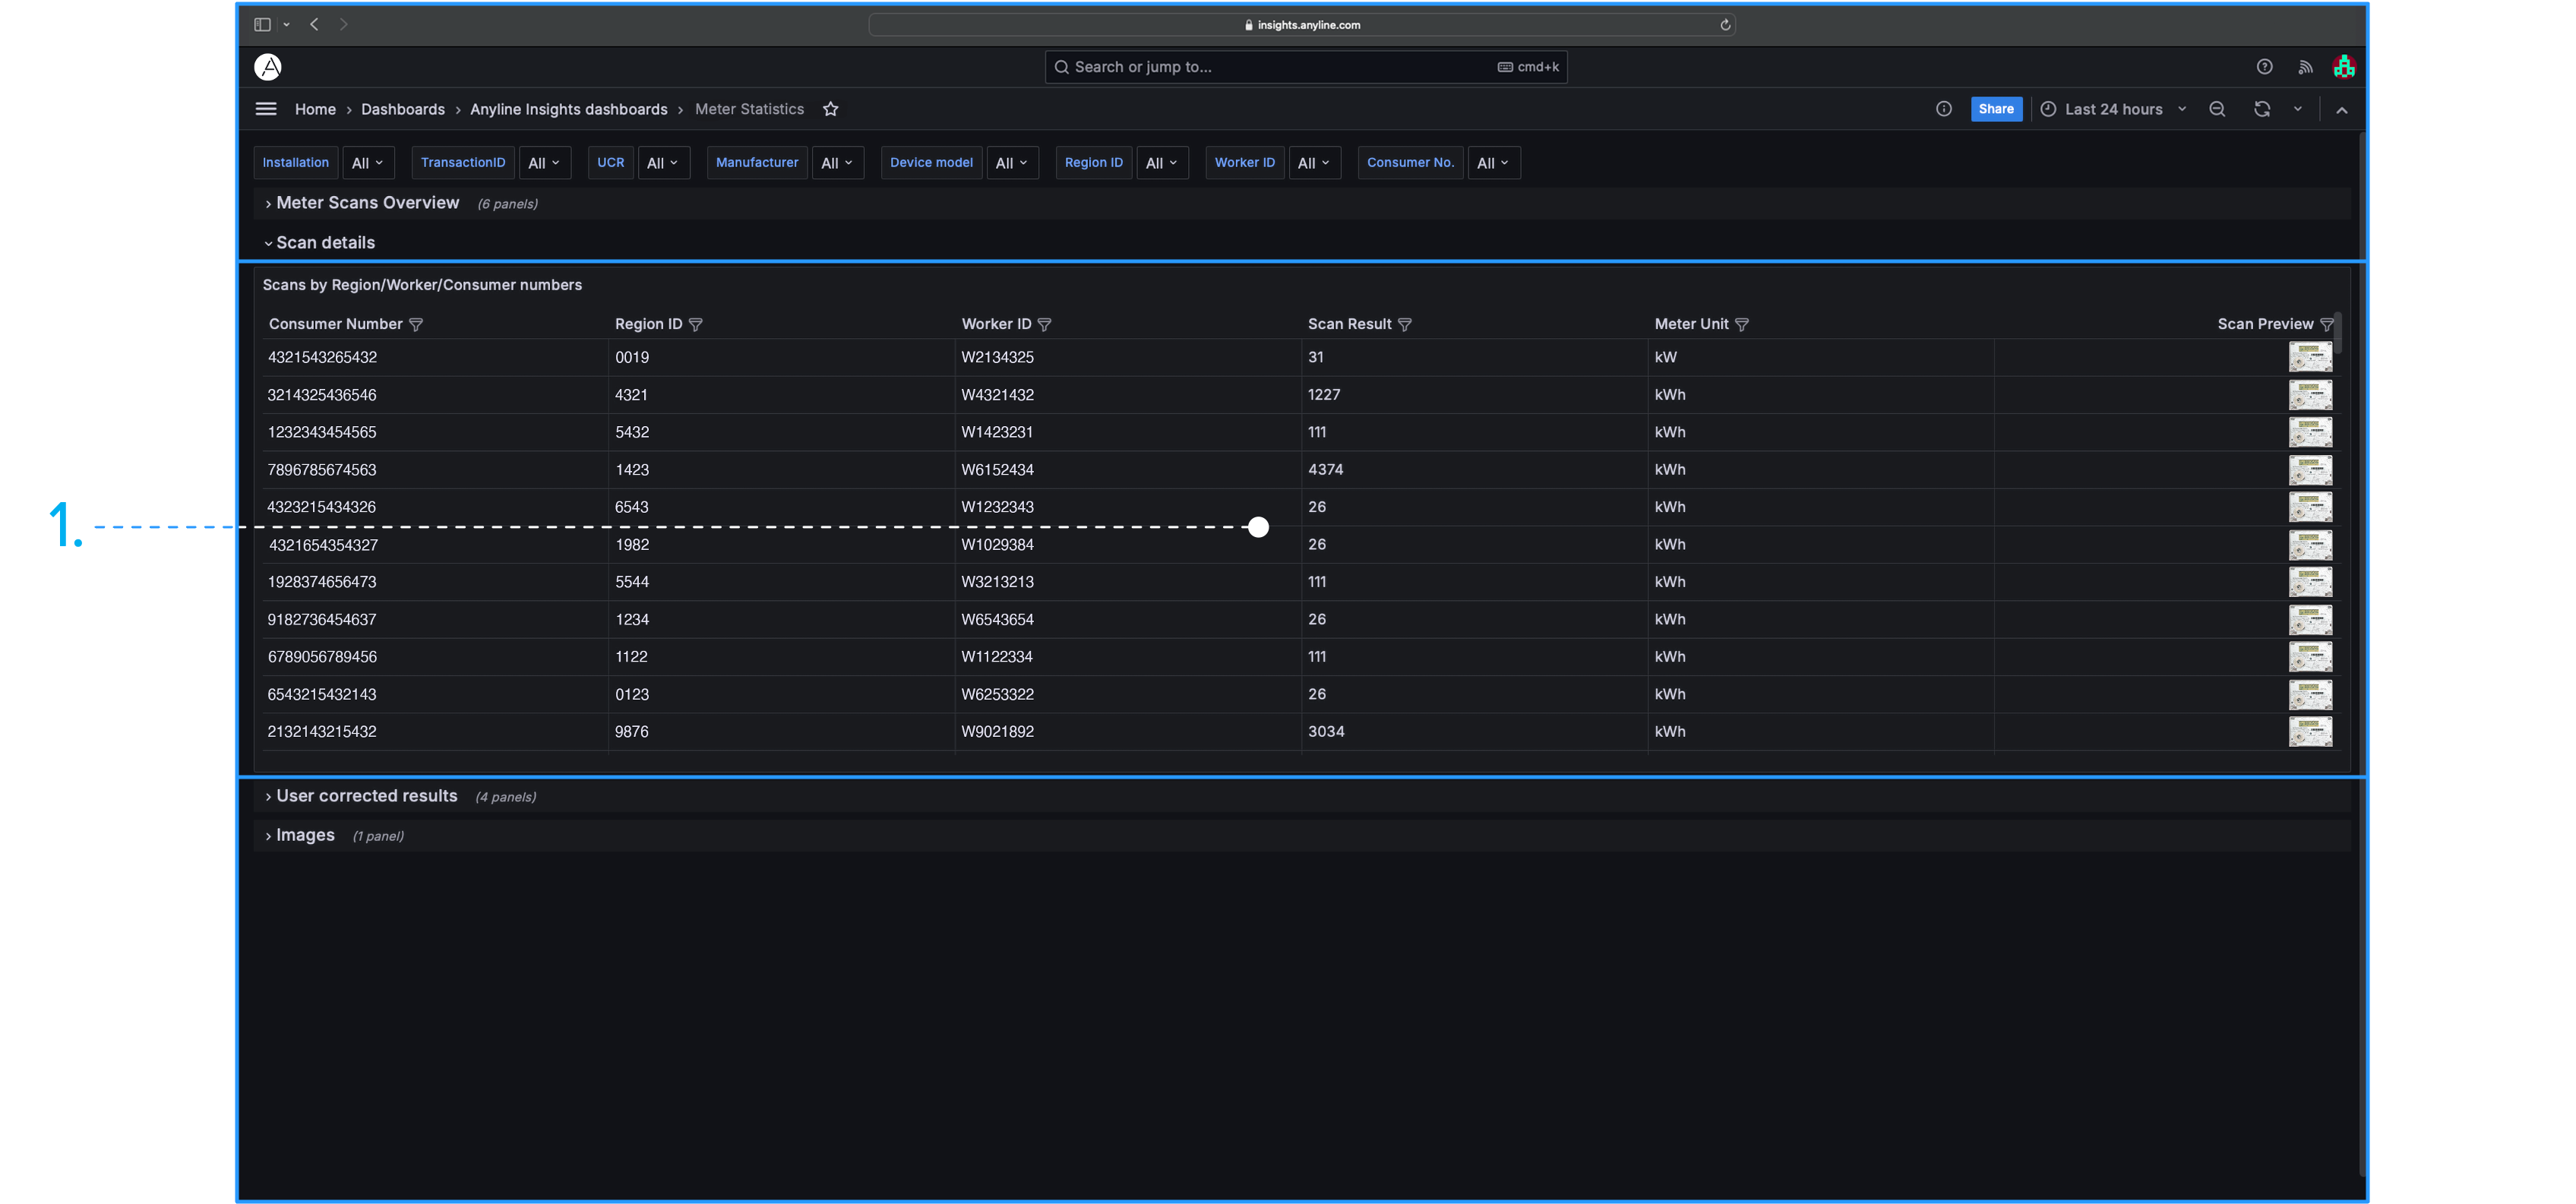
The Panel Filters in Meter Statistics are included in 1 Panel: The "Scans by Region/Worker/Consumer Numbers" Panel.
Each Panel Filter is located near the title of each column within these Panels and Filters by values given in each column.
| When hovering over each column title, the 'Toggle SortBy' option is displayed. Clicking on it will sort the information in the selected column in either ascending or descending order. |
"Scans by Region/Worker/Consumer Numbers" Panel Filters
Here are the Filters included in the "Scans by Region/Worker/Consumer Numbers" Panel.
|
|
| All Filters marked with (****) are Business Event Tracking Parameters. |
| Click on the Preview of the Scanned Image in "Scan Preview" to open the Image in a new tab. |

Main Body (Panels and what they mean)
Meter Statistics contains 4 different Sections, each composed of their own Panels.
| By default, all metrics displayed in the below Panels are calculated for the last 24 hours. Please apply your desired changes within the Time/Date Range Filter to update these metrics within these Panels. |
-
Meter Scans Overview
-
Scan Details
-
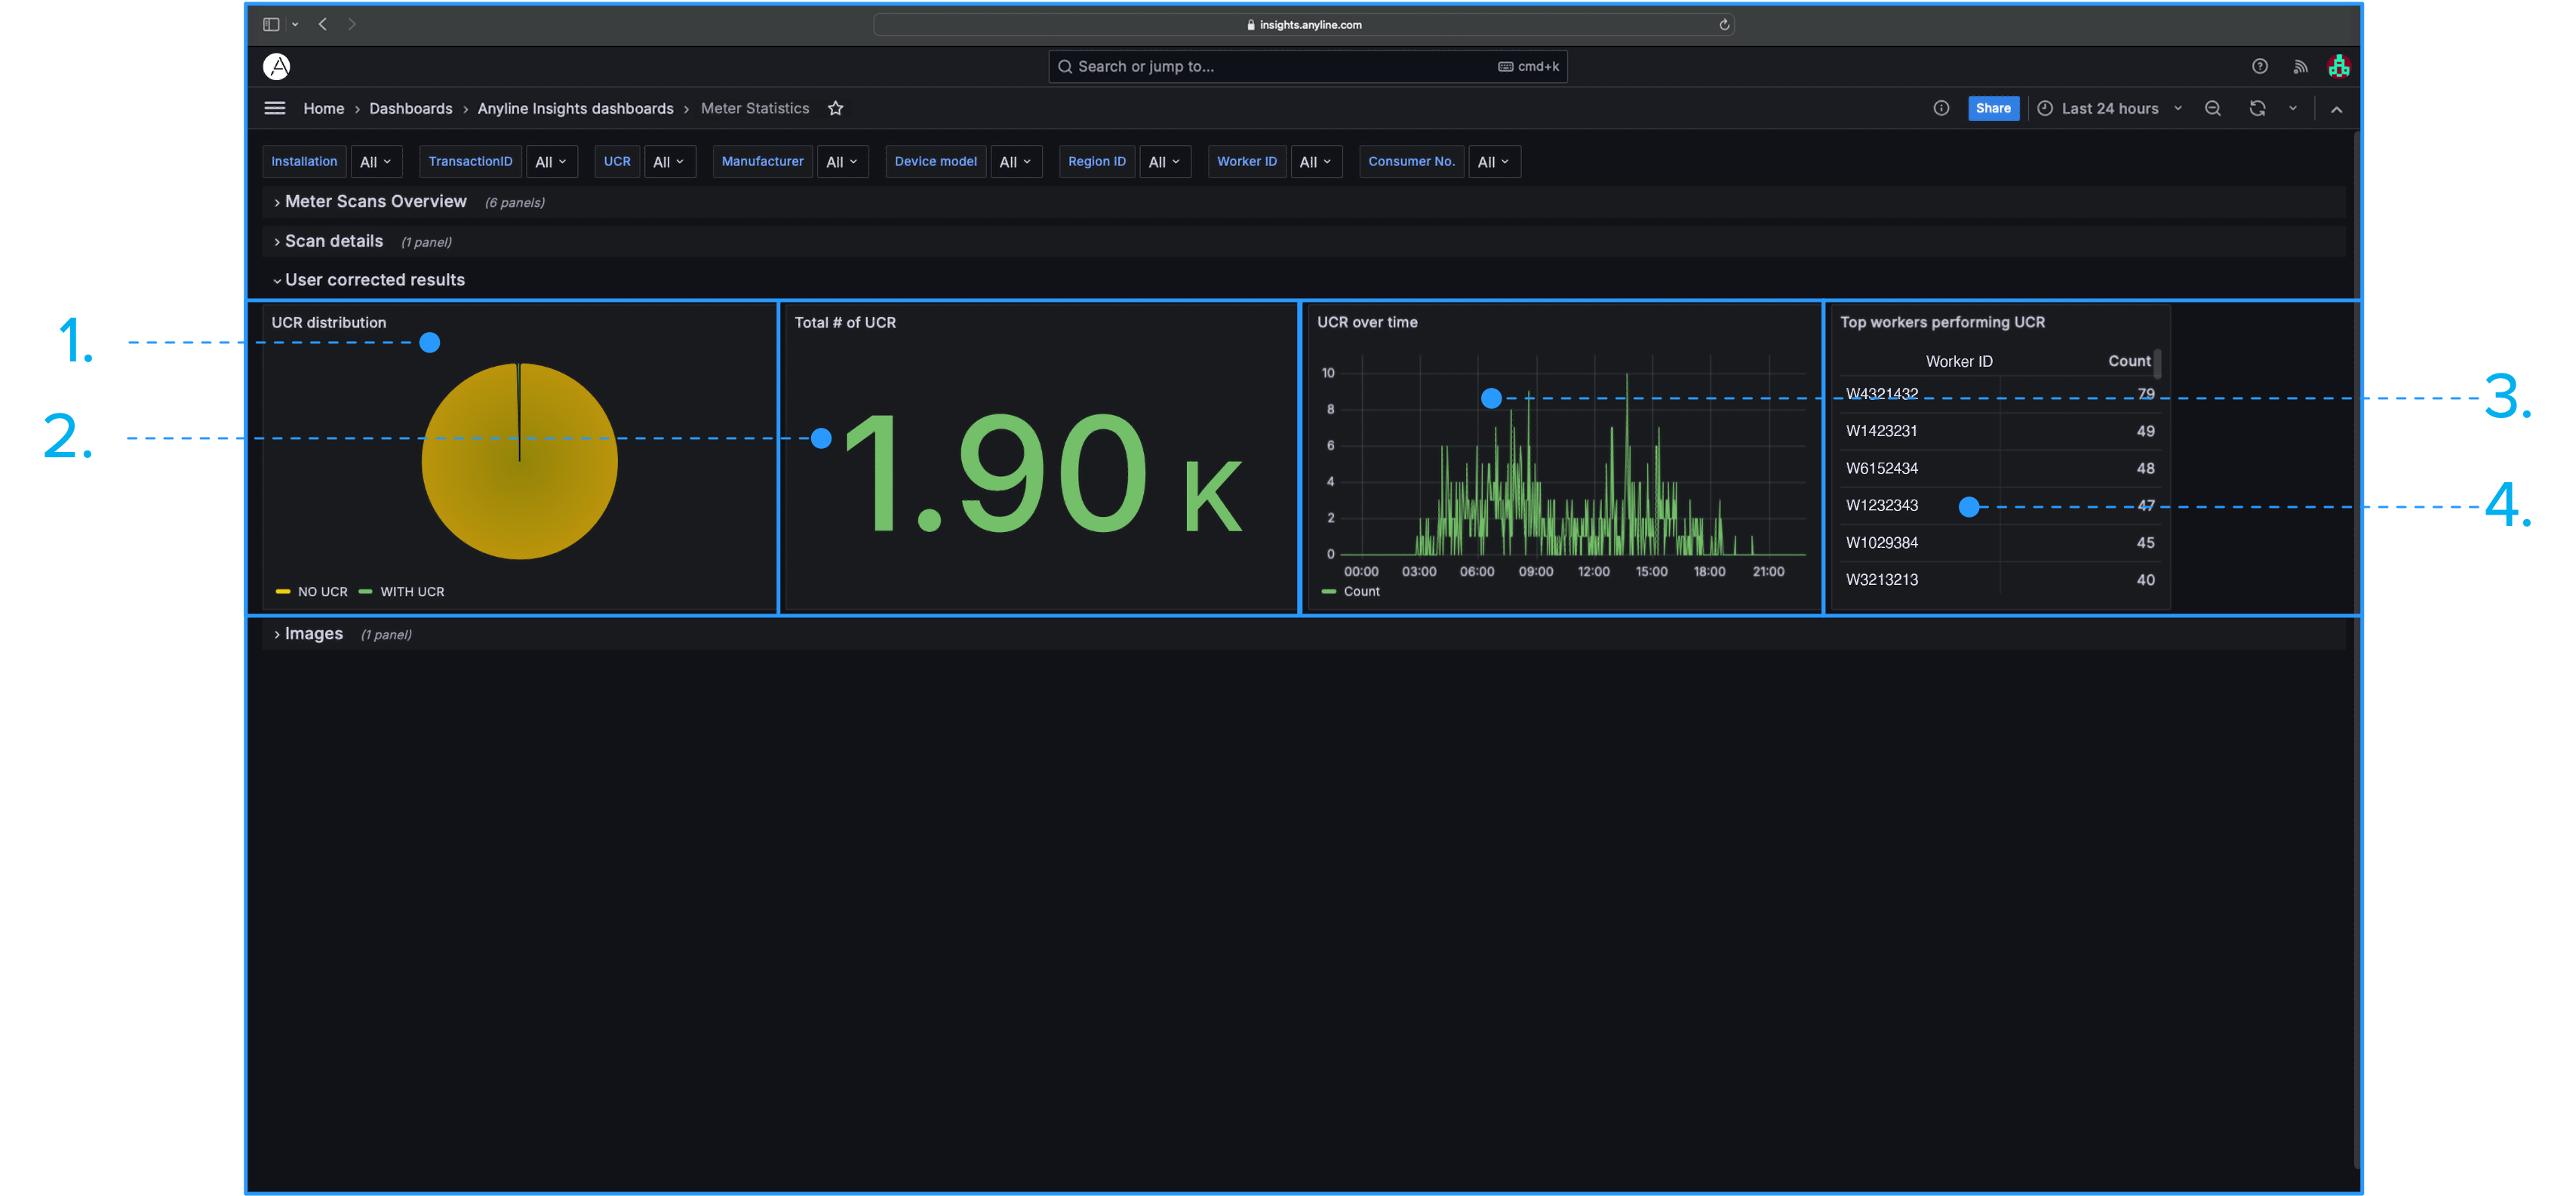
User Corrected Results
-
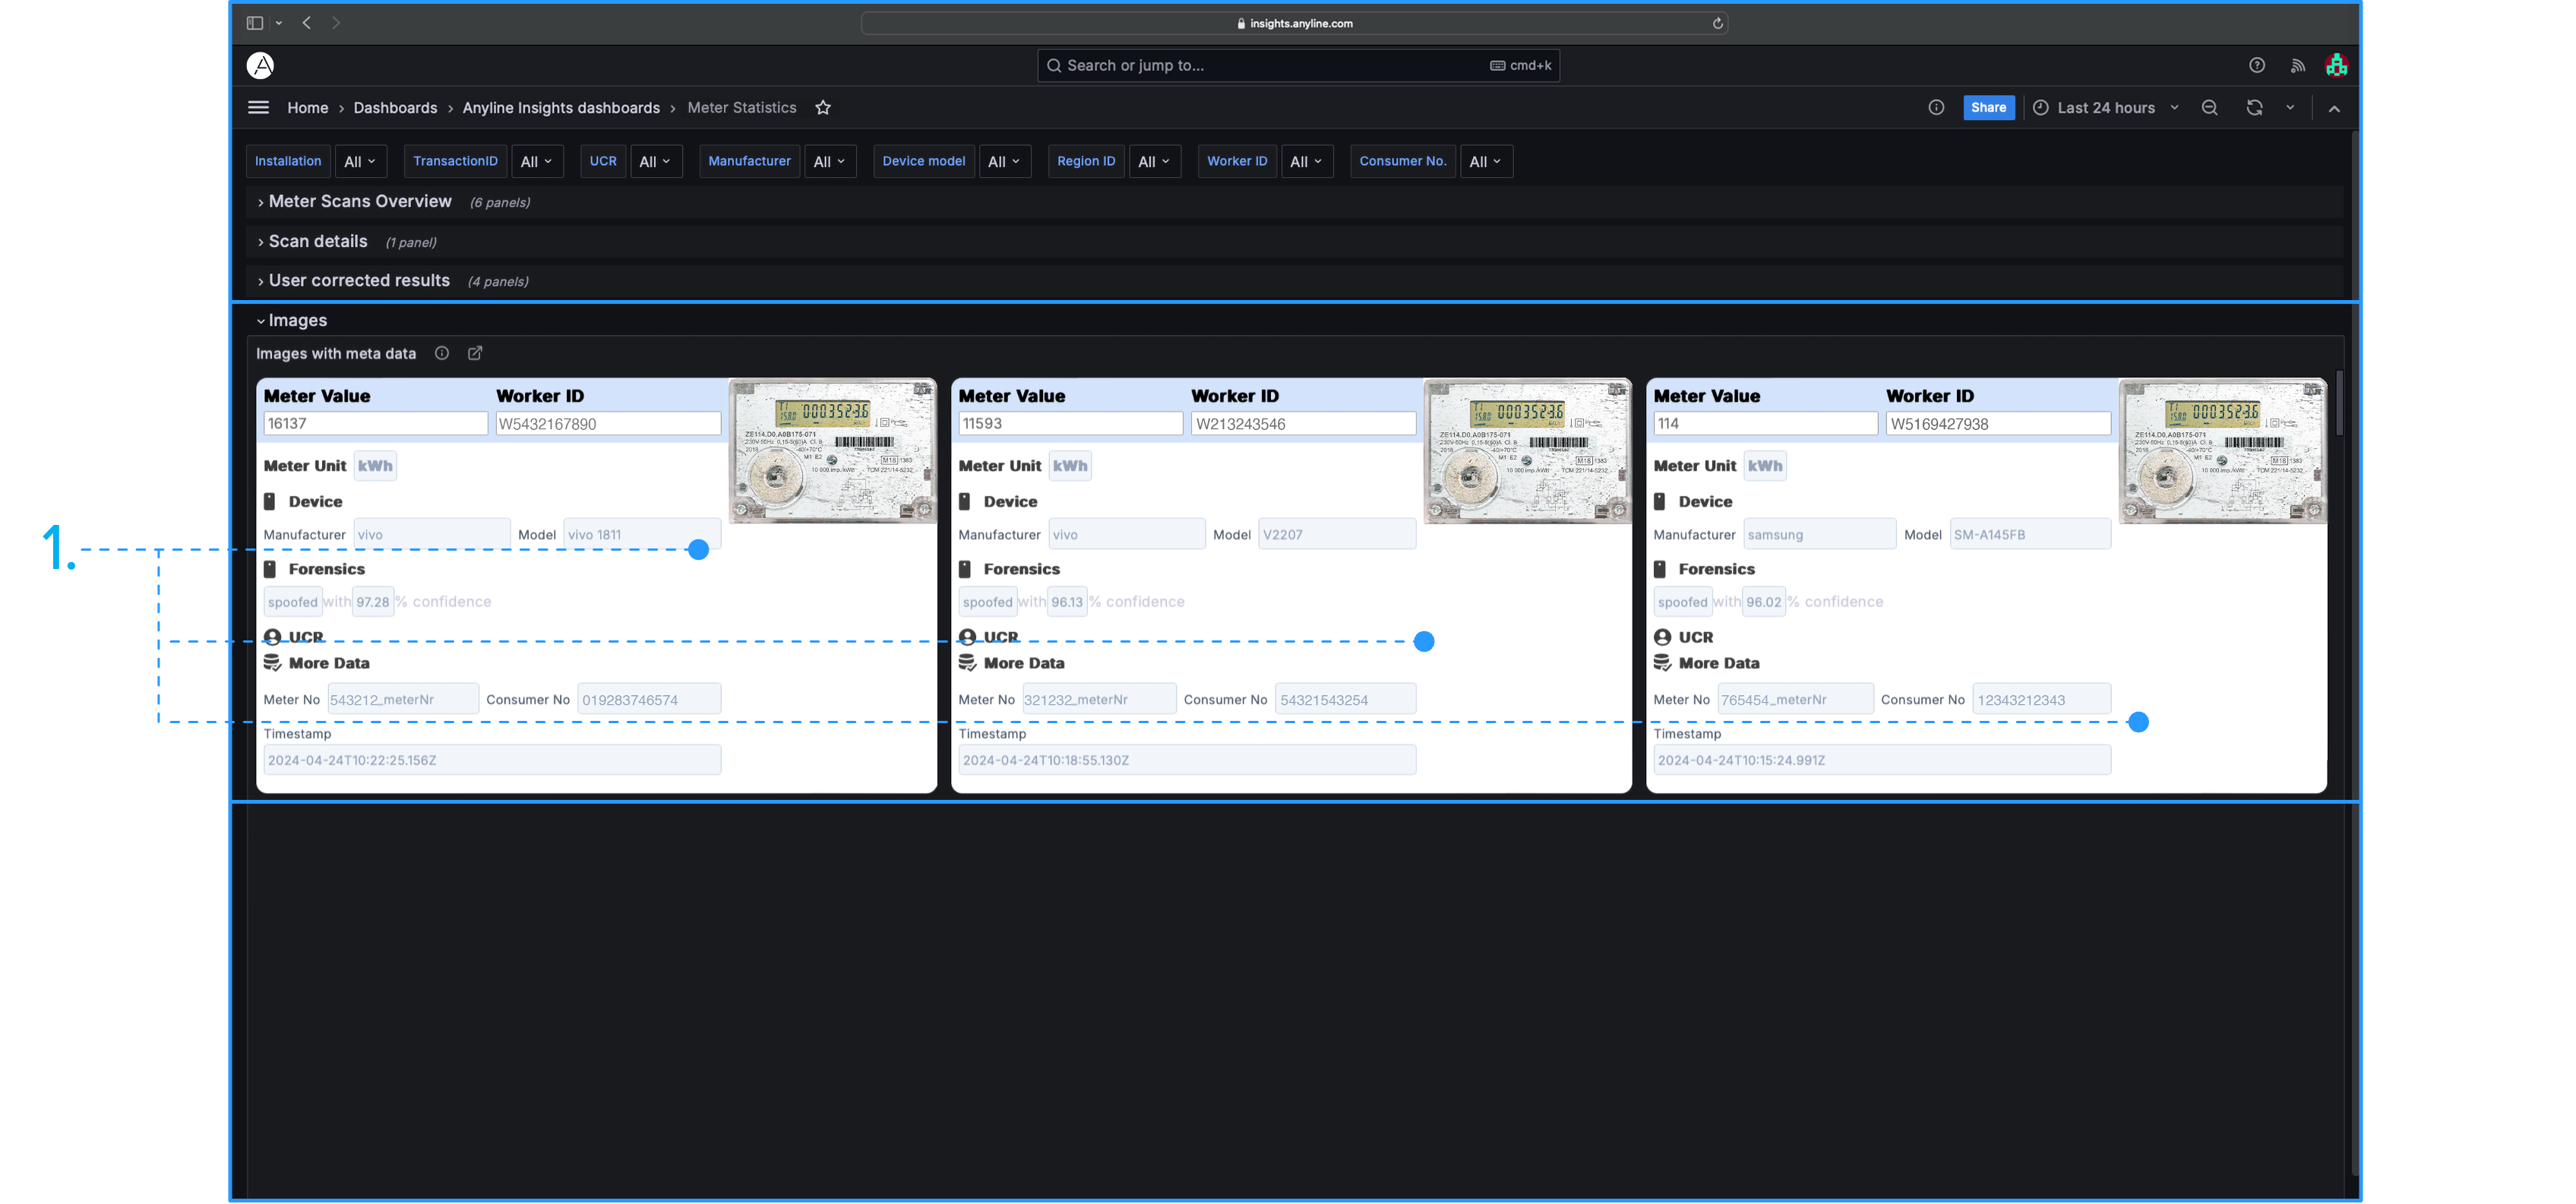
Images
Information about each Panel in "Meter Scans Overview".

|
|
Information about the "Scans by Region/Worker/Consumer Numbers" Panel in "Scan Details".

|
|
All Panels marked with (**) contain Panel Filters. All Panels marked with (***) require Business Event Tracking Parameters (e.g., Worker ID, Region ID, Consumer Number, or a combination of these) to be provided. |
Information about each Panel in "User Corrected Results".

|
|
| All Panels marked with (***) require Business Event Tracking Parameters (e.g., Worker ID, Region ID, Consumer Number, or a combination of these) to be provided. |
Information about the "Images with Metadata" Panel in "Images".

|
| The Image Cards require both Worker ID and Consumer Number to display the "Worker ID" and "Consumer No" values on the Image Card. If either of these is not provided, the Image Card will still be available, but the missing "Worker ID" or "Consumer No" will simply return an empty result. |