Tire Condition has a separate dedicated page solely for tire tread measurement information, known as the Measurement Profile. The Measurement Profile provides much more elaborate insights on any individual Tire Tread Scan.
Both the Tire Condition Dashboard and Measurement Profile have their own unique set of Filters and Panels, and do not contain any other Filters and Panels found on other Dashboards. The Data on either of the Dashboards' Panels will vary based on the Filters you select.
|
|
The Filter Section of every Anyline Insights Dashboard contains both a Time/Date Range Filter and Data Filter.
The Time/Date Range Filter contains the same features and options on every Dashboard from each Module and is mentioned on the Modules Home Page.
|
The Data Filter in Tire Condition has 2 options to choose from and Filter your Tire Tread Scan Data on the Dashboard. Here are the 2 Filters available on Tire Condition.
- Tire Condition
-
A list of various Tire Tread Depths to Filter the condition of all scanned tires. The tread depth options are "Less than 1.6mm", "1.6mm to 3mm", "3mm to 4.6mm", "4.6mm to 6mm", and "More than 6mm".
|
- Measurement Success
-
Provides Filters to find the Tire Measurements which are either successful, unsuccessful, or both.
|
Tire Condition Data Filter
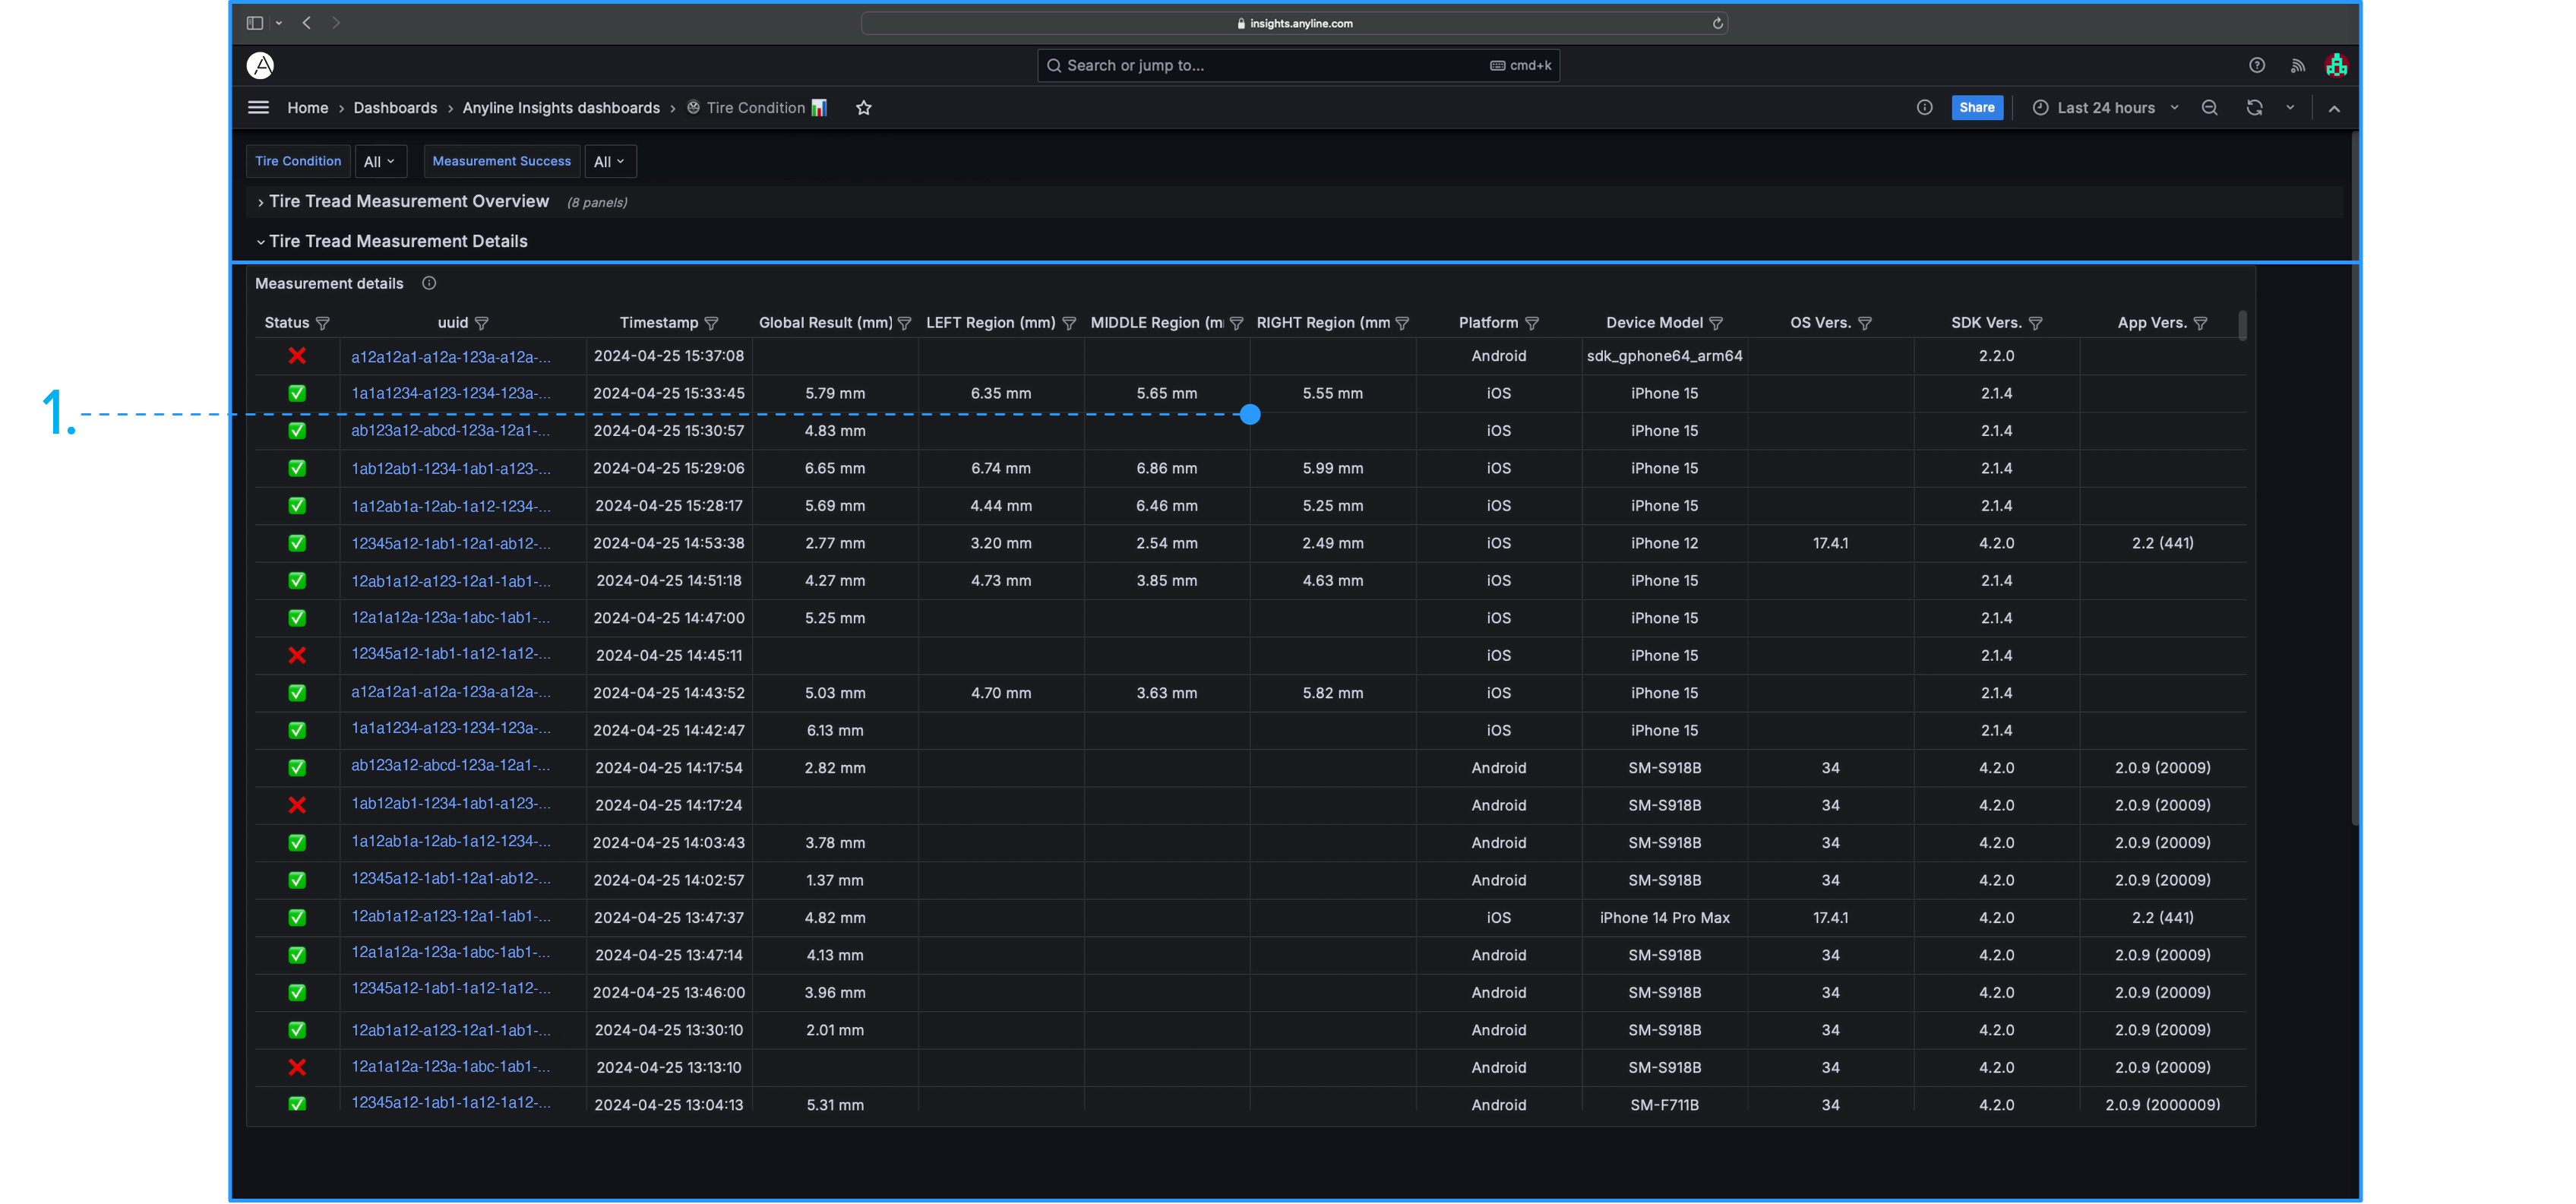
The Panel Filters in Tire Condition are included in 1 Panel: The "Measurement Details" Panel. Each Panel Filter is located near the title of each column within these Panels and Filters by values given in each column.
Tire Statistics Panel Filter Icons
|
|
When hovering over each column title, the 'Toggle SortBy' option is displayed. Clicking on it will sort the information in the selected column in either ascending or descending order.
|
Here are the Filters included in the "Measurement Details" Panel.
- Status
-
Displays whether the Tire Tread Scan was successful or not.
- UUID
-
Displays the UUID Text from each scanned tire.
- Timestamp
-
Provides a Date and Time when the Scan took place.
- Global Result (mm)
-
Refers to the Overall Measurement Result of the scanned tire, shown in millimeters.
- LEFT Region (mm)
-
Refers to the Measurement Result of the scanned tire from the Left Region, shown in millimeters.
- MIDDLE Region (mm)
-
Refers to the Measurement Result of the scanned tire from the Middle Region, shown in millimeters.
|
- RIGHT Region (mm)
-
Refers to the Measurement Result of the scanned tire from the Right Region, shown in millimeters.
- Platform
-
Displays a breakdown of which Device Platforms are used to scan (Android, iOS, etc.).
- Device Model
-
Displays a breakdown of the Device Models used to scan.
- OS Version
-
Shows which Mobile OS Version, from either Android or iOS, was used during the Tire Tread Scan.
- SDK Version
-
Shows which Version of the Anyline Tire Tread SDK was used during the Tire Tread Scan.
- App Version
-
Shows which Version of the Anyline Tire Tread SDK App was used during the Tire Tread Scan.
|
Panel Filters for "Measurement Details"
|
|
To open the Measurement Profile, please click on any one of the UUIDs listed in the "Measurement Details" Panel.
|
|
|
The information below is only relevant to the Measurement Profile, which is accessed via the "Measurement Details" Panel located on the Tire Condition Dashboard.
|
The Data Filter in the Measurement Profile has 1 option to choose from and filter your Tire Tread Scan Data on the Dashboard. Here is the Filter available on the Measurement Profile.
- Measurement
-
A list of each UUID from all scanned tires. Unlike other Filters, only one variable value can be selected at a time.
Measurement Profile Data Filter
Tire Condition contains 2 different Sections, each composed of their own Panels.
A non-sectioned Body is available when any of the UUIDs are selected in the "Measurement Details" Panel. This opens the Measurement Profile as a separate page from the Tire Condition Dashboard, solely to show "Measurement Details" in much further detail, with its own unique selection of Panels.
|
|
By default, all metrics displayed in the below Panels are calculated for the last 24 hours. Please apply your desired changes within the Time/Date Range Filter to update these metrics within these Panels.
|
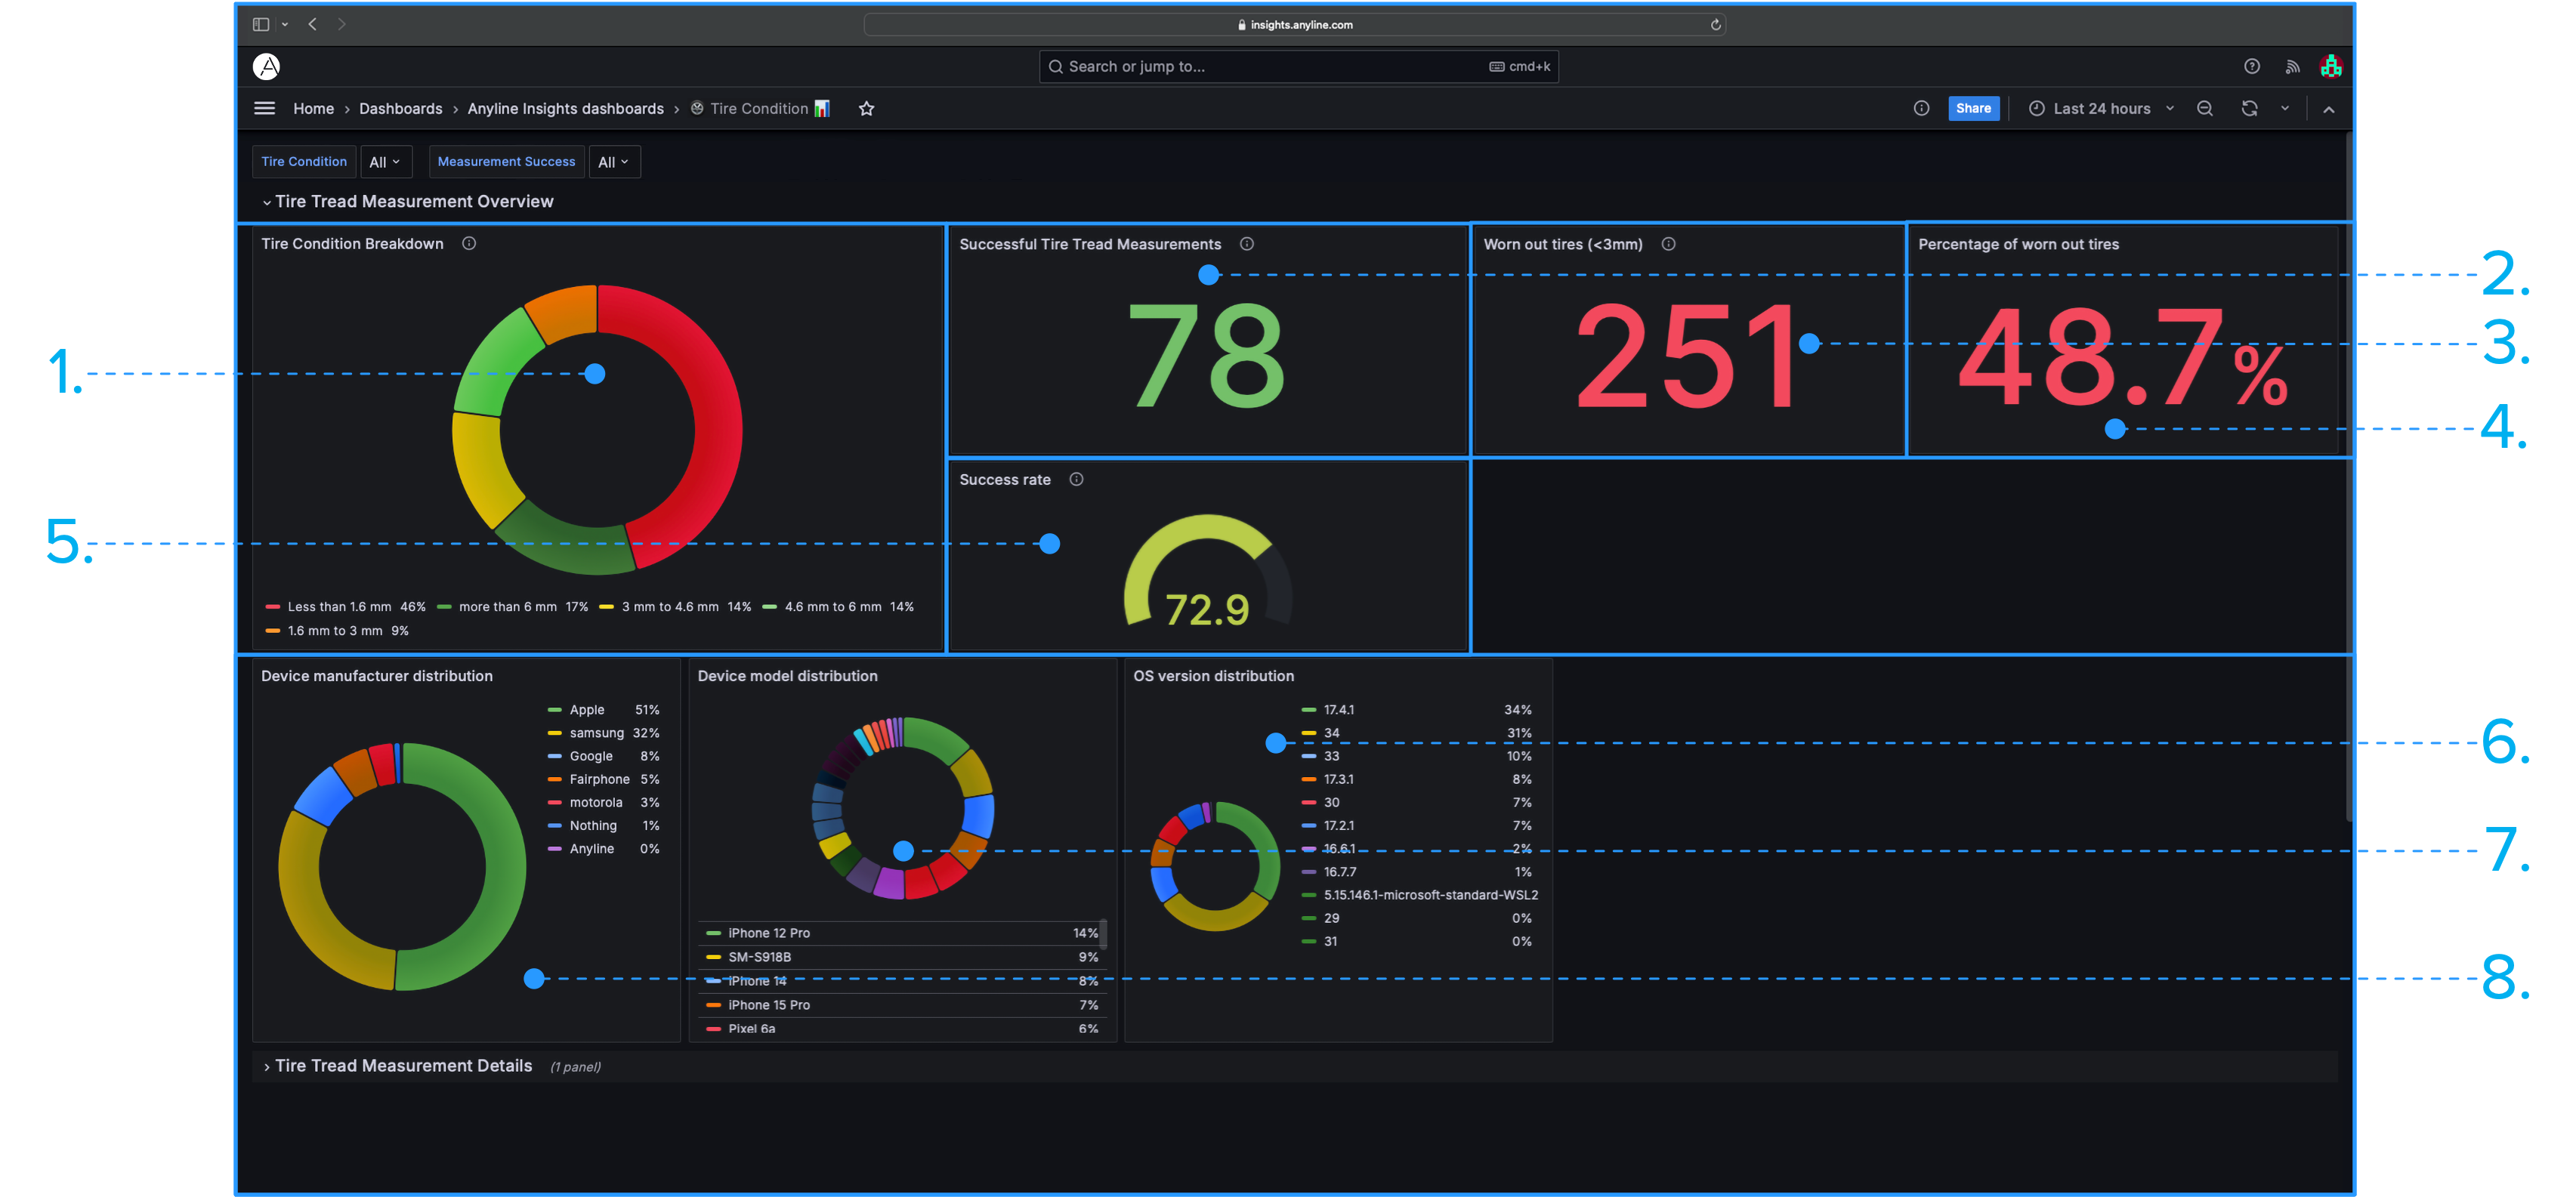
Information about each Panel in "Tire Tread Measurement Overview".
"Tire Tread Measurement Overview
- 1. Tire Condition Breakdown:
-
Displays a Pie Chart and List of the scanned tires and their condition (shown as either "Less than 1.6mm", "1.6mm to 3mm", "3mm to 4.6mm", "4.6mm to 6mm", or "More than 6mm").
- 3. Worn Out Tires (<3mm):
-
Shows the total number of scanned worn out tires based on all the Tire Tread Scan Data.
- 5. Success Rate:
-
Displays a graph and number indicating the total success rate of scanned tires based on all the Tire Tread Scan Data.
- 7. Device Model Distribution:
-
Displays a Pie Chart and List of the Models of the Devices used to scan.
|
- 2. Successful Tire Tread Measurements:
-
Shows the total number of successful measurements based on all the Tire Tread Scan Data.
- 4. Percentage of Worn Out Tires:
-
Shows the total percentage of scanned worn out tires based on all the Tire Tread Scan Data.
- 6. OS Version Distribution:
-
Displays a Pie Chart and List of the Operating System of the Devices used to scan.
- 8. Device Manufacturer Distribution:
-
Displays a Pie Chart and List of the Manufacturers of the Devices used to scan.
|
Information about each Panel in "Tire Tread Measurement Details".
"Tire Tread Measurement Details
- 1. Measurement Details(**):
-
A chart with multiple columns displaying additional scanning information related to any Tire Tread Scan.
|
|
|
|
All Panels marked with (**) contain Panel Filters.
|
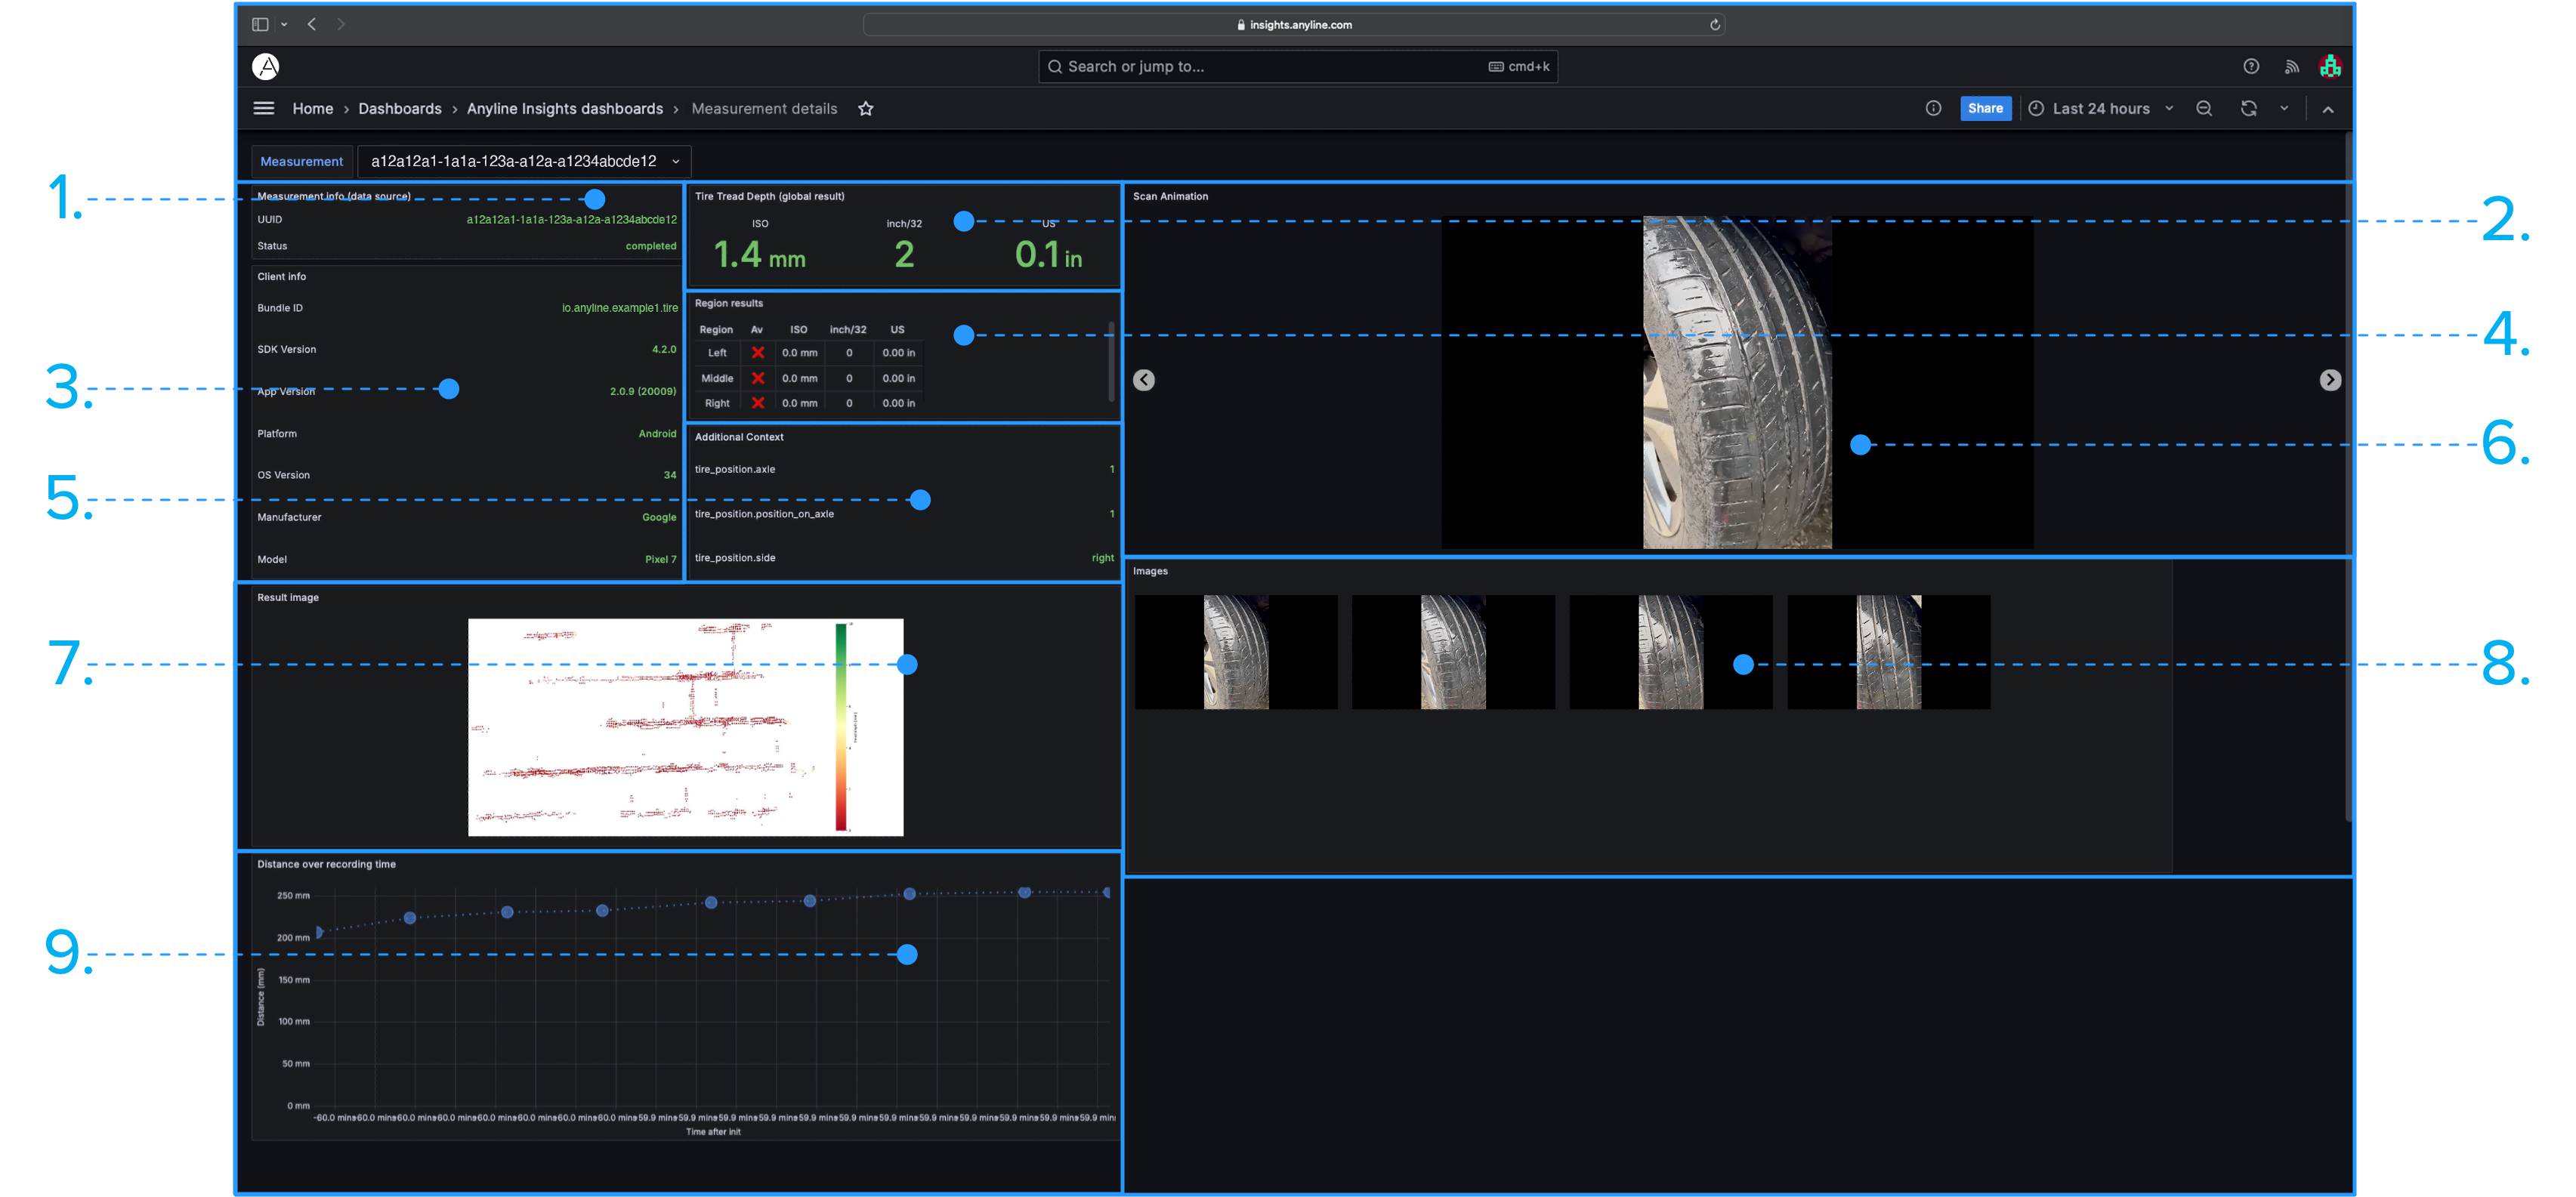
Information about each non-sectioned Panel in the Measurement Profile.
"Measurement Profile" Panels
- 1. Measurement Info (Data Source):
-
Shows certain information about each measurement that took place, including the UUID as well as a Status to confirm whether the Scan was successfully completed or not.
- 3. Client Info:
-
Shows additional information about each measurement that took place, including the Bundle ID, SDK Version, App Version, Platform, Operating System of the Mobile Device used for scanning, the Device’s Manufacturer, and the Device’s Model.
- 5. Additional Context:
-
Provides further context and information from the Tire Tread Scan, including which axle the tire is on, which side of the axle the tire is located, and if it is on the left or the right side of the car.
- 7. Result Image:
-
Displays a 3D Depth Map/Surface Plot of the scanned tire, where the x and y coordinates correspond to the position of the tire and the z coordinate (represented by colour) corresponds to the tread depth of the tire.
- 9. Distance over Recording Time:
-
Refers to the distance between the Device recording the Tire Tread Depth and the tire itself per frame over the entire Recording Time. The distance is measured in millimeters and is on the y-axis, while the time after the recording started is measured along the x-axis from left to right.
|
- 2. Tire Tread Depth (Global Result):
-
Displays the Overall Measurement Result of the scanned tire in either millimeters, 32nds of an inch, or inches.
- 4. Region Results:
-
Displays certain information about the results based on the region (the left, middle, or right side of the tire) and the measurement (displayed in either millimeters, 32nds of an inch, or inches).
- 6. Scan Animation:
-
Displays a collection of images, from a Scan, played together as an animation. The framerate of the Scan Animation is set to 2.5fps (frames per second).
- 8. Images:
-
Displays the frames used in the animation as individual static images.
|


