Getting Started


Scan Data Dashboard

What is Scan Data Dashboard?

The Anyline Insights Scan Data Dashboard is a Data Capture Intelligence Tool that gathers all of your Scan Data together into one platform.The Scan Data is aggregated into a result set, which is then presented to the user through either an unfiltered Dashboard or a filtered view based on user selections. All Scan Data is automatically categorized into various visual representations such as Heat Maps, Tables, Graphs, Bar Charts, Pie Charts, and Image Libraries (with and without Metadata).

How does it benefit me?

Scan Data Dashboard generates a centralized monitoring system and a comprehensive reporting experience. This streamlined design benefits users by providing a unified solution to monitor, manage, and analyze Scan Data across multiple modules both easily and efficiently. With all Scanned Events being reported in real-time, you are always given the latest insights from the most recent Scan Data and images.

Does Scan Data Dashboard work with every Module?

Each of our Modules is accessible, allowing for direct reporting of your information onto the Scan Data Dashboard. The entire set of Scan Data is then collected and visualized in real-time.


Understanding Scan Data Dashboard

Here, we will show you how easy it is to access and navigate your collected Scan Data using the Anyline Insights Scan Data Dashboard.

You can choose to either watch our instructional video tutorial or read the technical documentation below, which covers each feature of the Scan Data Dashboard.

Video Tutorial

Anyline Insights Scan Data Dashboard Tutorial

Dashboard

Scan Data Dashboard has its own unique set of Filters and Panels along with some other Filters and Panels found on other Dashboards. The data on this Dashboard’s Panels will vary based on the Filters you select.


Scan Data Dashboard Data Filter

The Filter Section of every Anyline Insights Dashboard contains both a Time/Date Range Filter and Data Filter.

The Time/Date Range Filter contains the same features and options on every Dashboard from each Module and is mentioned on the Modules Home Page.

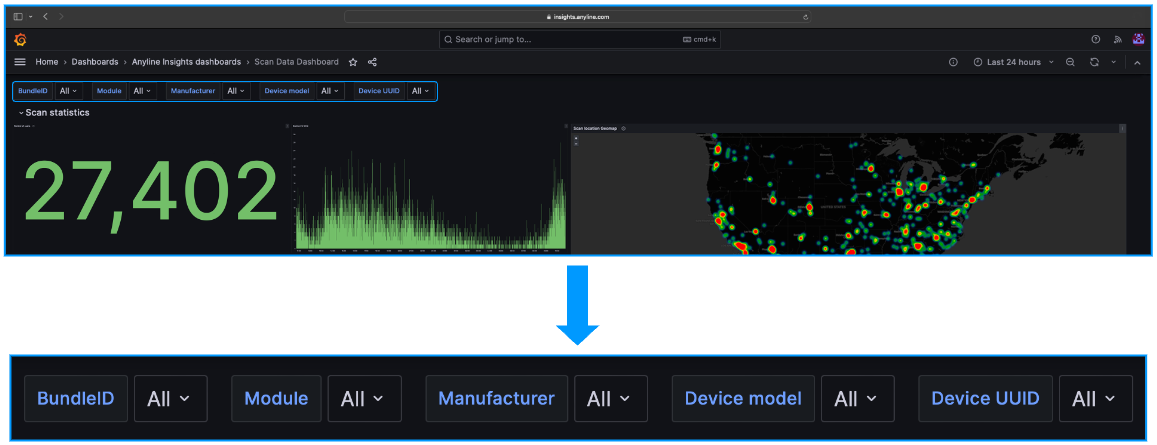
The Data Filter in Scan Data Dashboard has multiple options to choose from and filter your Scan Data on the Dashboard. Here are some of the main Filters available on Scan Data Dashboard.

BundleID

The Application or Bundle Identifier(s) used on your application.

Device Model

The Model of the Mobile Device(s) using the application.

DeviceUUID

The Universal Unique Identifier generated by the Anyline SDK referring to a successful installation on a device.

Module

A list of the available Anyline Scanning Capabilities (Tire, ID, etc.).

Manufacturer

The Manufacturer of the Mobile Device(s) using the application.

An image of the Data Filter on Anyline Insights
Scan Data Dashboard Data Filter


Main Body (Panels and what they mean)

Scan Data Dashboard contains 2 different Sections, each composed of their own Panels.

  • Scan Statistics

  • Images

Information about each Panel in "Scan Statistics".
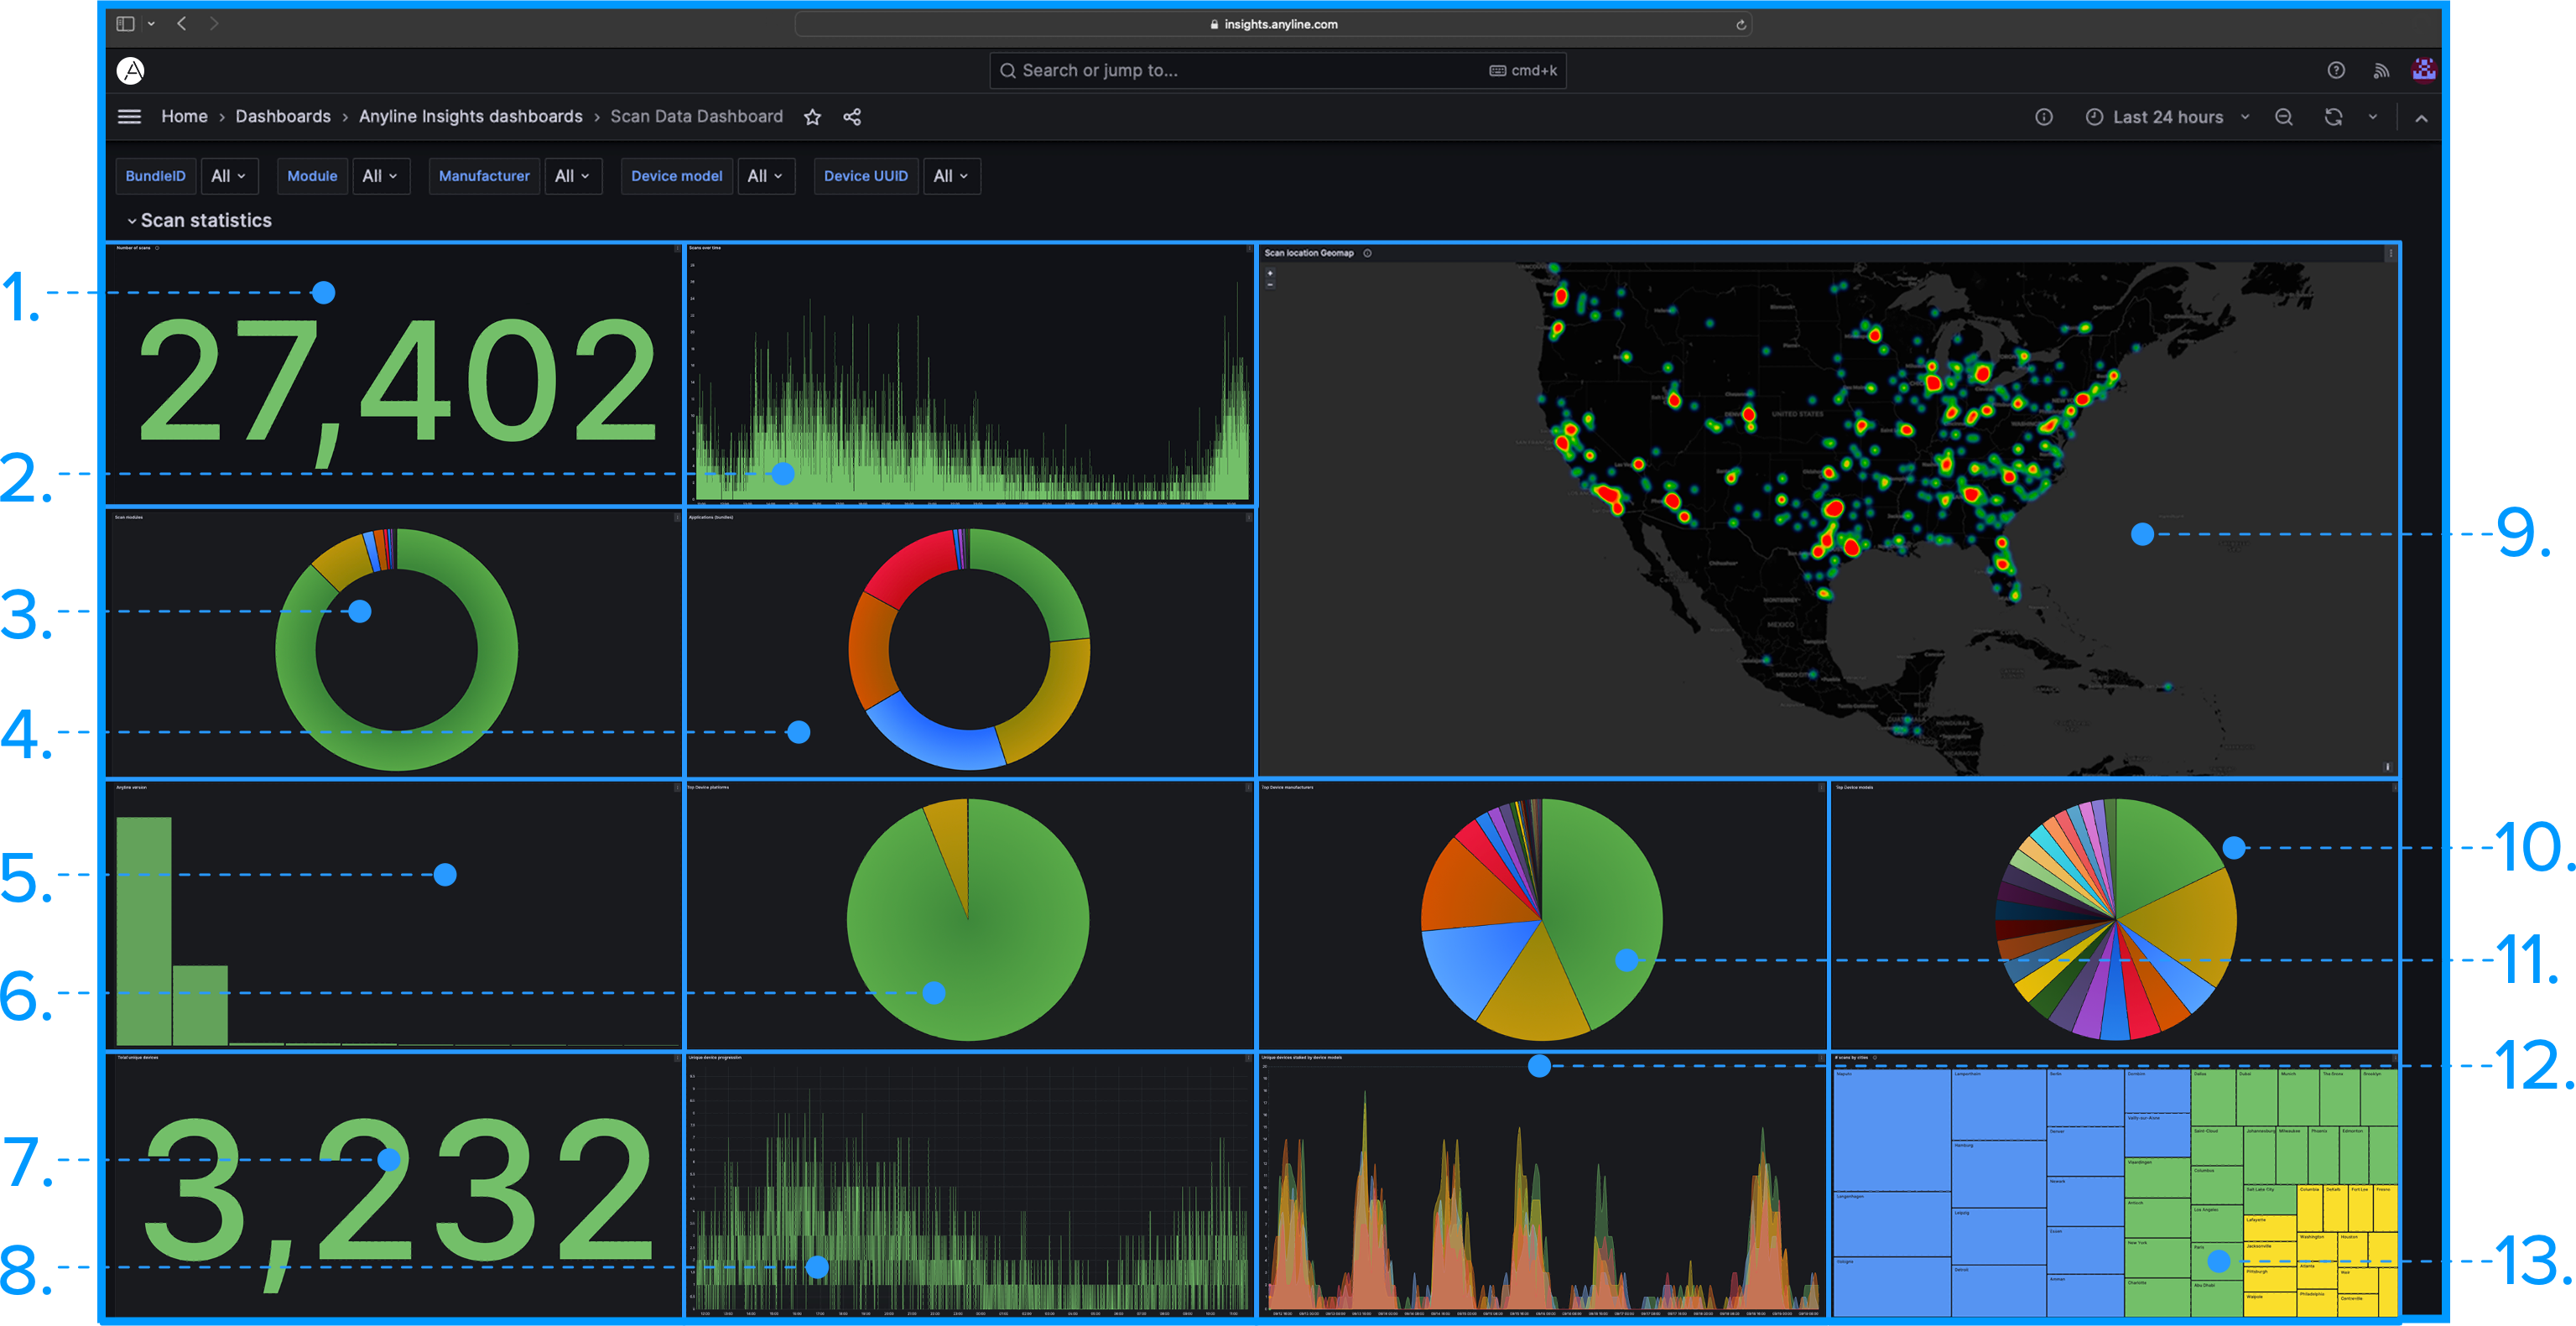
An image of Scan Statistics
Scan Statistics
1. Number of Scans:

Immediately find out how many Scans have been performed during the set time frame.

2. Scans Over Time:

Distribution of the Total Number of Scans over the Set Time/Date.

3. Scan Modules:

Displays the available Anyline Scan Modules being used in an application.

4. Applications (Bundles):

Breakdown of Application IDs/Bundle IDs being used to scan.

5. Anyline Version:

Breakdown of the Number of Scans Carried Out Using an Anyline Version.

6. Top Device Platforms:

Displays the most popular device platforms being used to scan.

7. Total Unique Devices:

Shows how many Unique Devices are being used to scan during the set time frame.

8. Unique Device Progression:

Distribution of the Number of Unique Devices Used Over the Set Time/Date Range.

9. Scan Location Geomap(*):

Displays a Heat Map of Scan Activity anywhere on the Planet.

10. Top Device Models:

Breakdown of Top Device Models Used to scan.

11. Top Device Manufacturers:

Breakdown of Top Device Manufacturers Used to scan.

12. Unique Devices Staked by Device Models:

Distribution of the Number of Unique Devices Used Over the Set Time/Date Range by Device Model.

13. Number of Scans by Cities(*):

Tree Map of Cities with Scan Activity Sorted by Scan Volume.

All Panels marked with (*) are available with Reporting turned to ON.

Information about each Panel in "Images".
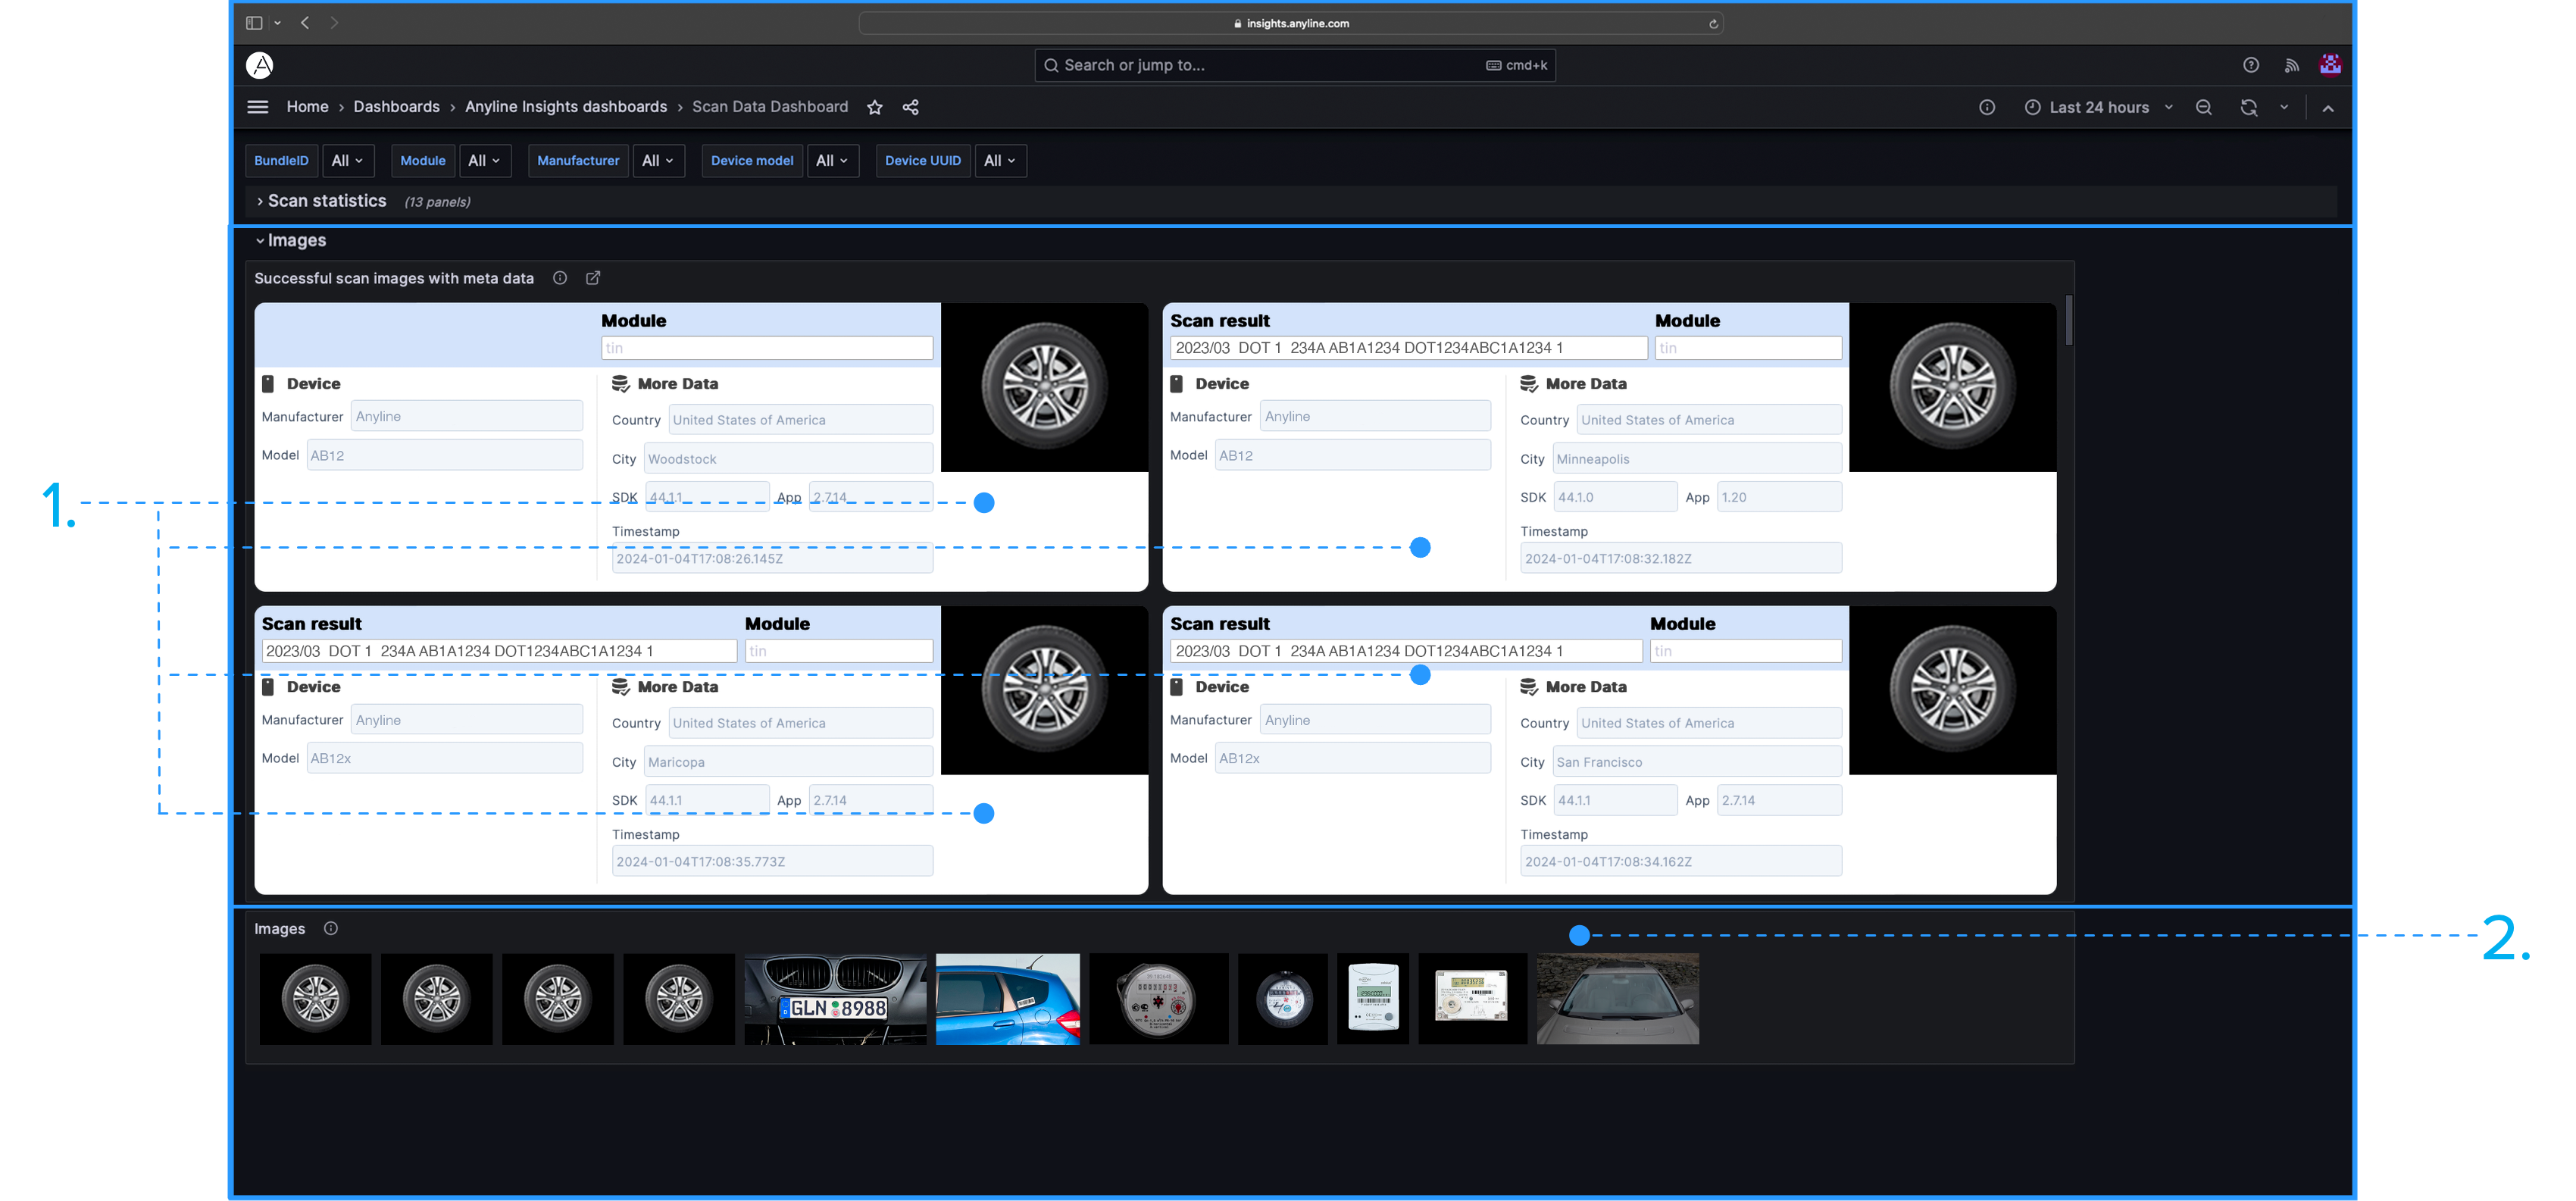
An image of the Scan Data Dashboard "Images" Panel
Images
1. Successful Scan Images with Metadata(*):

Displays the last 100 Images with Metadata.

2. Images(*):

Gain easy access to all images that were scanned.

All Panels marked with (*) are available with Reporting turned to ON.