Anyline Insights Modules
Modules Overview
Anyline Insights offers a selection of modules tailored to your requirements, including:
Scan Data Dashboard
The Scan Data Dashboard is Anyline’s Single-Dashboard module, which accumulates all Scan Data into one platform and then categorizes the data into various panels, segregating the data and making it easier to find the specific data you are looking for. The Scan Data Dashboard can be used on all of Anyline’s Modules (Tire, MRZ, License Plate, etc.) and has filter options to display either one or multiple modules at a time.
Please check out our Scan Data Dashboard documentation to find out more.
Tire & Vehicle Analytics
 Tire & Vehicle Analytics is one of Anyline’s Multi-Dashboard modules, which divides all tire & vehicle data into 3 separate Dashboards - Vehicle Statistics, Tire Condition, and Tire Statistics. Each Dashboard contains a number of panels with some being shared across all 3 and others unique to each individual Dashboard.
Please check out our Tire & Vehicle Analytics documentation to find out more.
Meter Analytics & Forensics
Meter Analytics & Forensics is another one of Anyline’s Multi-Dashboard modules, which divides all meter data into 3 separate Dashboards - Meter Forensics, Meter Statistics, and UCR Investigation. Each Dashboard contains a number of panels with some being shared across all 3 and others unique to each individual Dashboard.
Please check out our Meter Analytics & Forensics documentation to find out more.
Login
| Customers who wish to have access to Anyline Insights must be signed up to our Anyline Enterprise Platform. Please either speak to your Customer Success Manager or book a meeting to find out more about accessing any of our Insights Modules. |
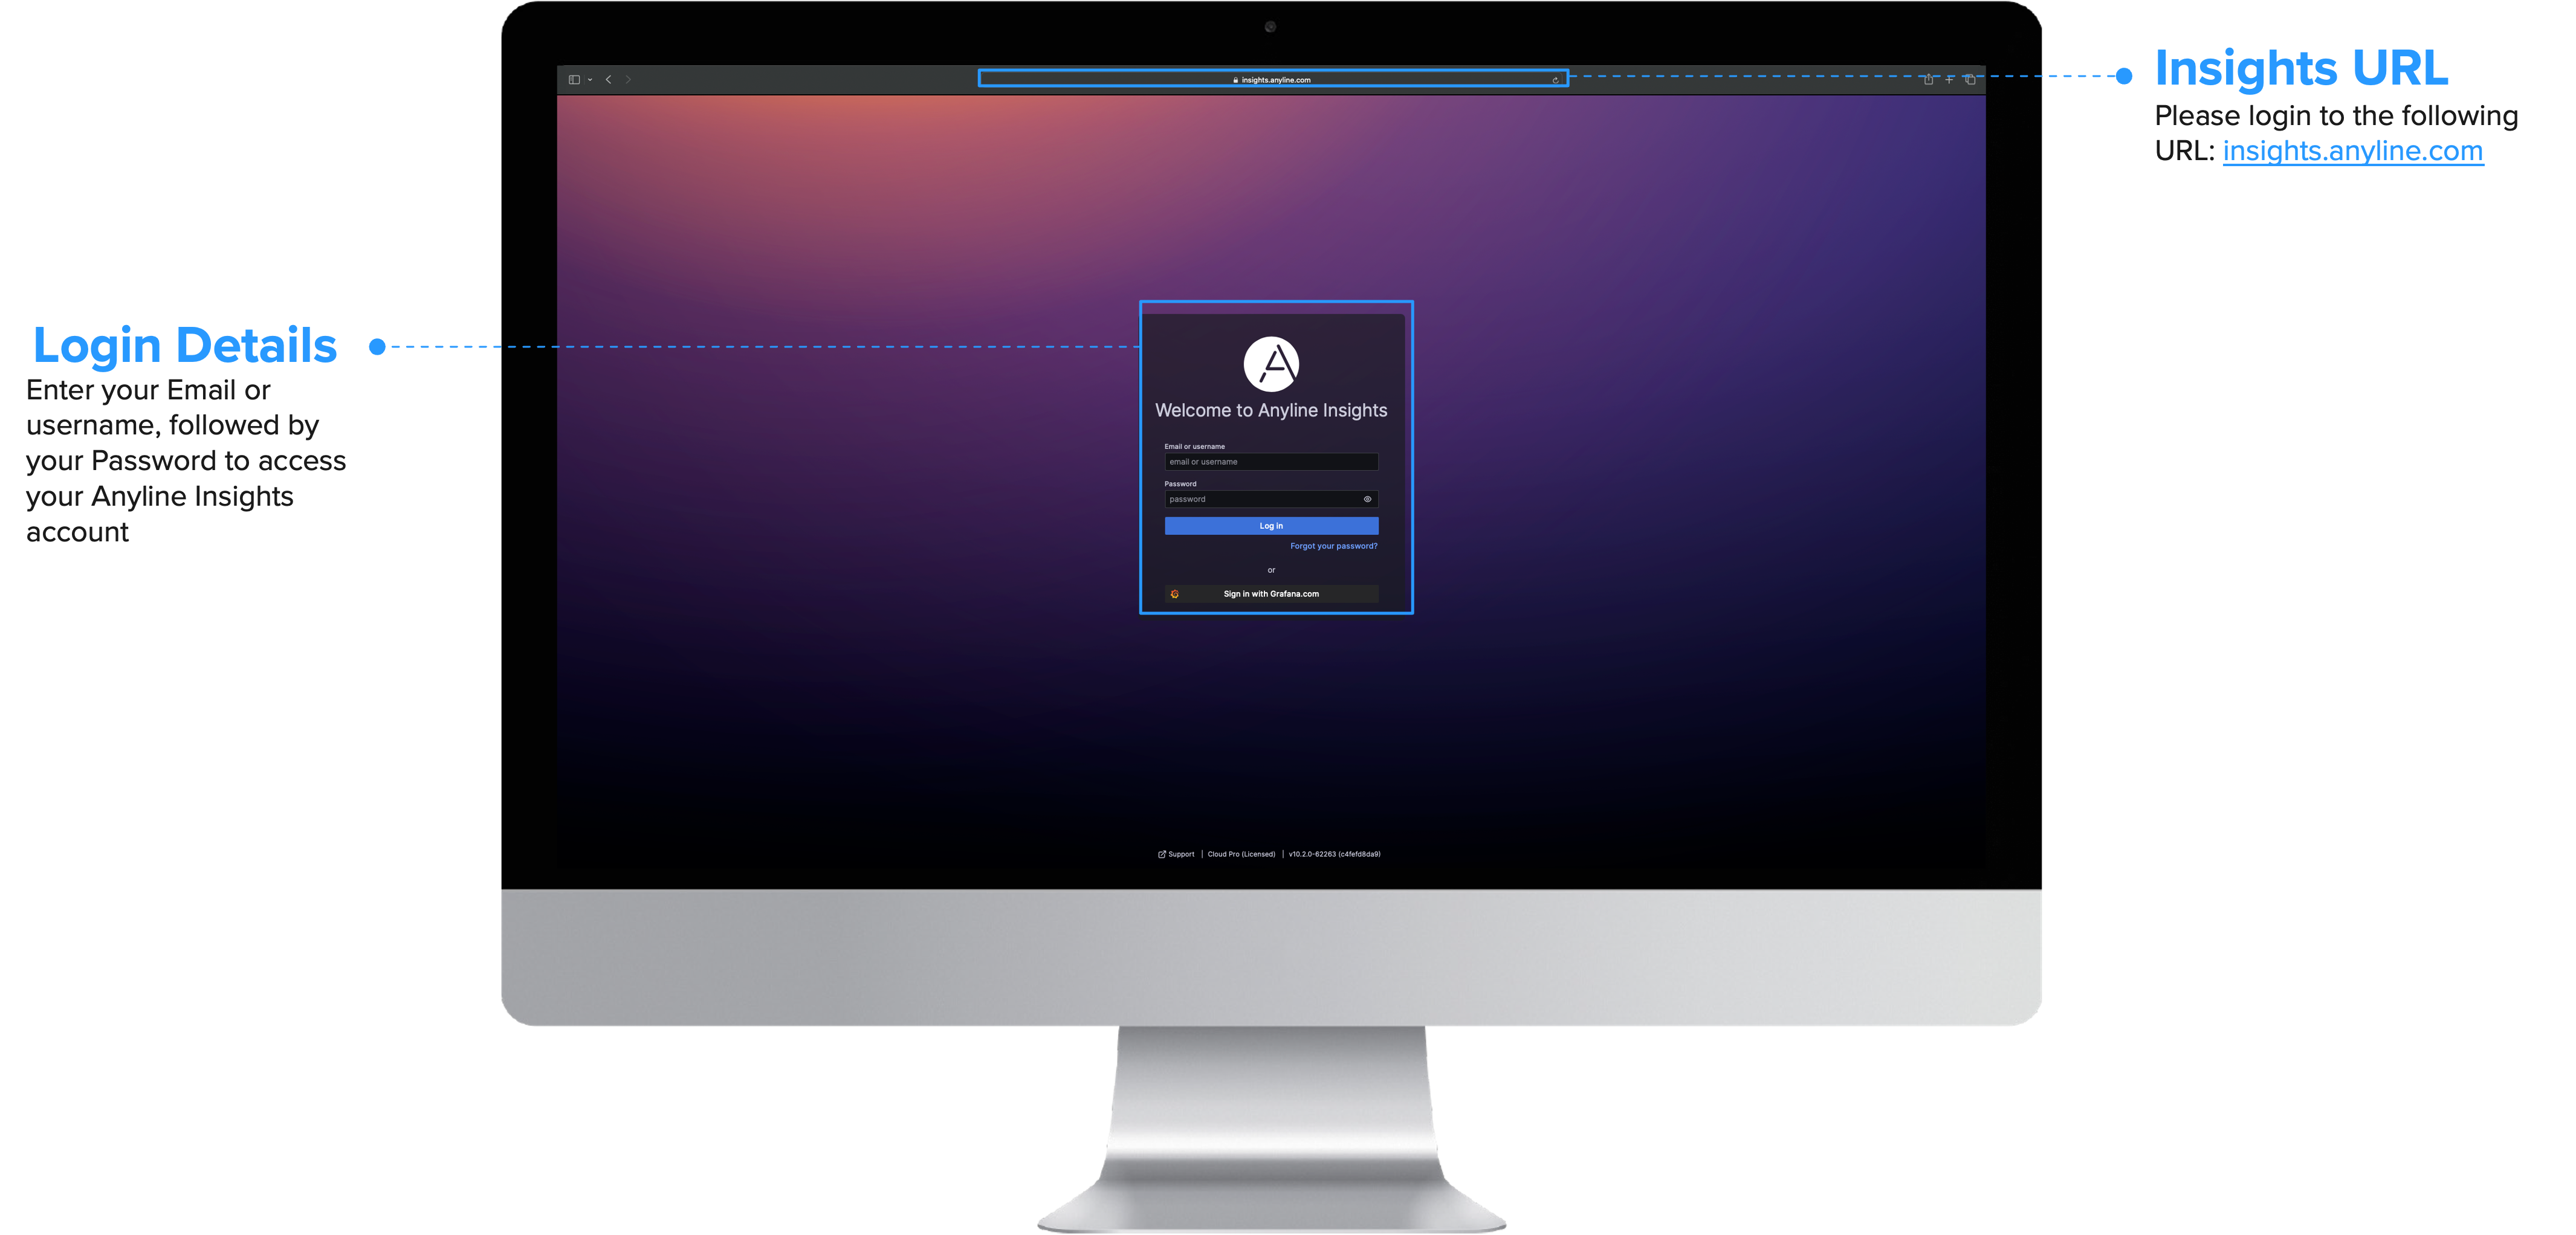
On a browser of your choosing, go to insights.anyline.com. From there, you will be asked to enter your Login Details. After entering your Email or username, followed by your password, you will then be taken to the Anyline Insights Home Page.
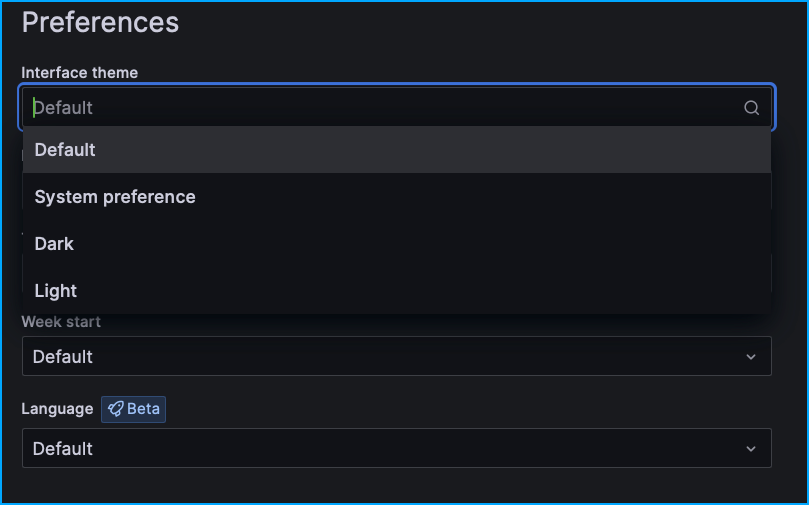
| There is an option to change the theme of your Dashboard to either a dark or light theme, depending on your preference. To change the theme, navigate to your profile at the top-right of the Dashboard and open it. In your profile, scroll down to "Preferences" and select your preferred theme for your Dashboard. |
Filter Section & Options
Each Dashboard of any Module contains a Filter Section, which is separated into two main categories: The Time/Date Range Filter and the Data Filter.
The Time/Date Range Filter
Please click to find out more
The Time/Date Range Filter alters the data displayed on your Dashboard based on the time and/or date range you select. Here are the options available in the Time/Date Range Filter:
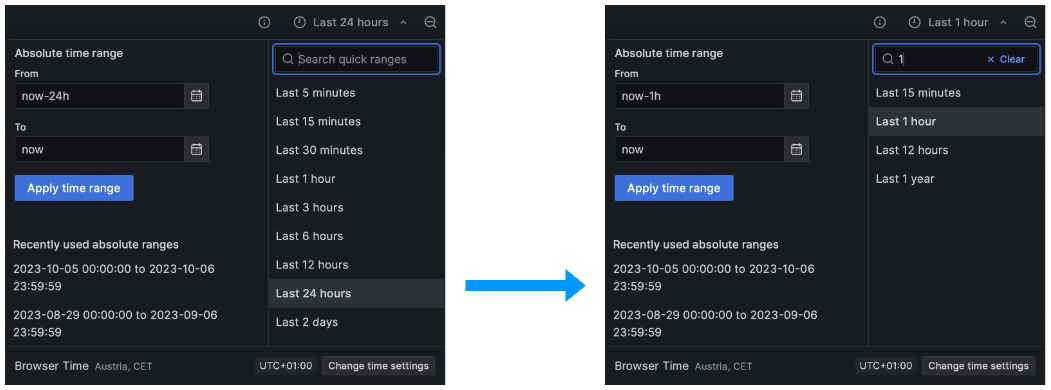
Quick Range Selector
Either click some listed time/date range presets to quickly select a listed date or time, or use the Search bar to choose any one of the quick ranges available.
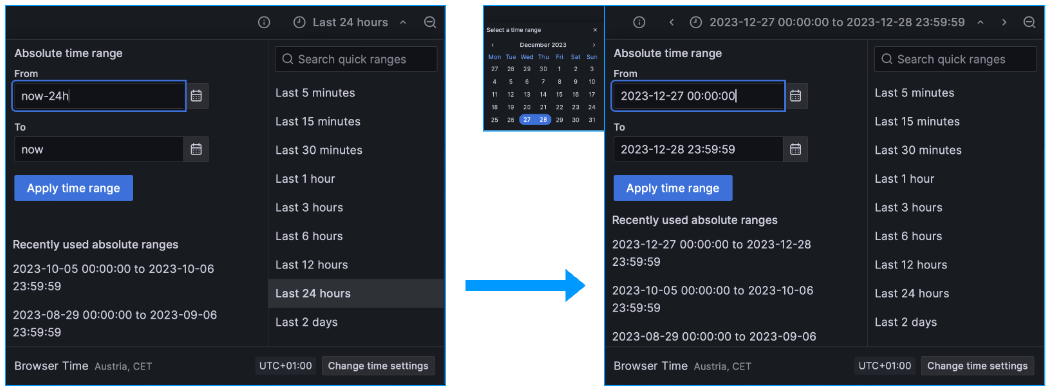
Absolute Time Range
The "Absolute Time Range" option shows 2 calendar buttons to open a calendar and apply a date range between 2 selected dates, which then changes the data on your Dashboard based on your selection. Most recently used ranges will be added below the Absolute Time Range, to conveniently select without having to add in the same dates again.
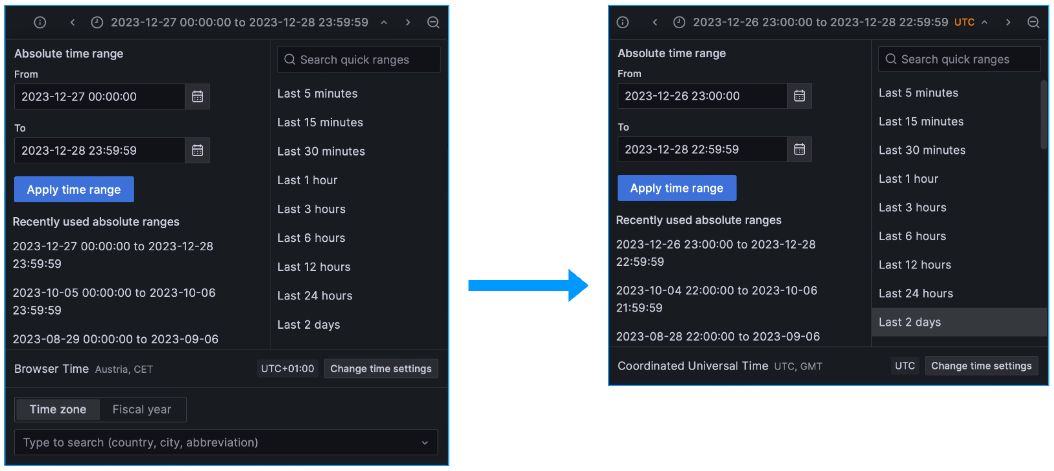
Change Time Settings
The "Change time settings" button provides an option to change both the Time Zone and the start of the Fiscal Year.
| The Time/Date Range Filter contains the same features and options on every Dashboard from each Module. |
The Data Filter
Please click to find out more
The Data Filter refines your data based on a wide range of selections either for your physical device(s) or your application(s). This range of Filter selections varies depending on the Module. Furthermore, Multi-Dashboard Modules, such as the Tire & Vehicle Analytics Module, offer different Filter selections on each of the 3 available Dashboards.
| To find out more about the Data Filters available on each Dashboard, please select any of our Dashboard documentation pages. |
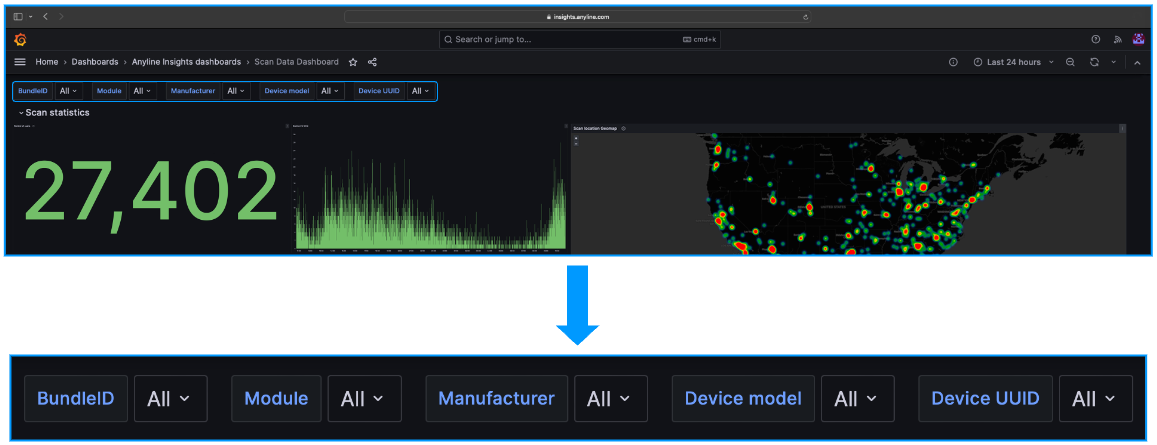
| Tire & Vehicle Analytics also has the Panel Filter, which is exclusive to the 3 Dashboards within this Module. |
The Panel Filters
Please click to find out more
The Tire & Vehicle Analytics Module has Dashboards with Filters in specific Panels. These Panels outline details that provide more thorough and relevant information.
For example: The "License Plate Details" Panel within Vehicle Statistics (one of the 3 Tire & Vehicle Analytics Dashboards) contains a chart with multiple columns displaying additional scanning information related to any License Plate Scan.
| To find out more about the Panel Filters available on each Dashboard, please select any of our Dashboard documentation pages within the Tire & Vehicle Analytics module. |

Sharing Section
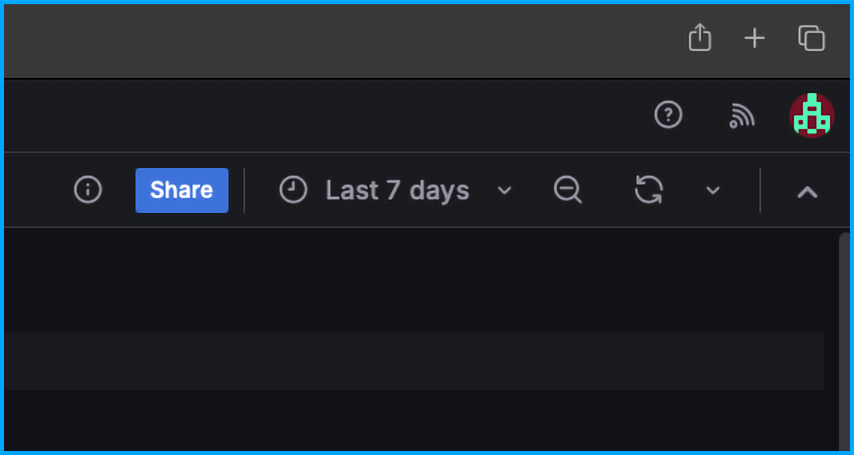
Each Dashboard comes with a Sharing Panel, offering some options for how to share your data. Open the Sharing Panel by selecting the "Share" Icon located near the top of the page, next to the Time/Date Range Filter.
-
Sharing Panel
-
Link
-
PDF
-
Share the entire Dashboard, by opening the Sharing Panel and selecting one of the available options:
-
Link
-
PDF
-
-
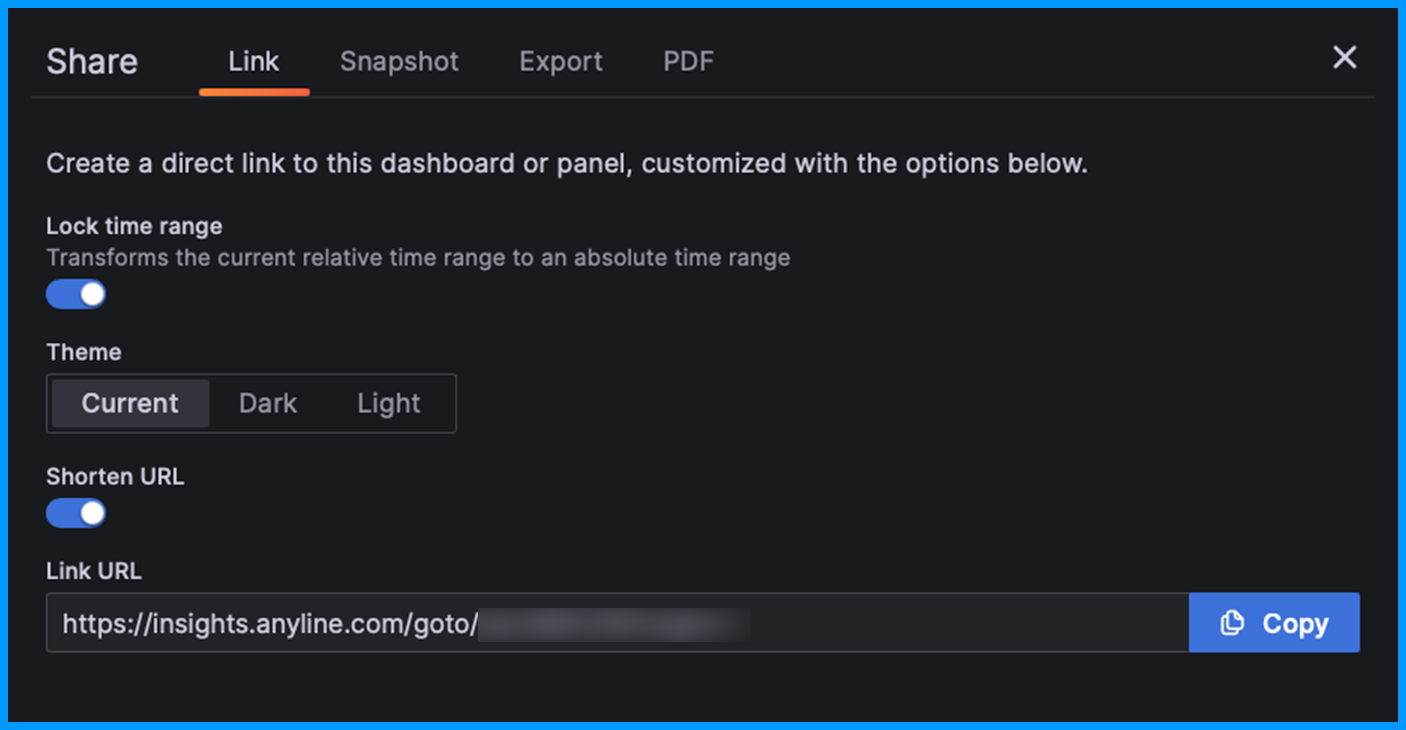
The Link Section provides a URL link to a Dashboard, allowing you to share a direct link with your colleagues.
-
Also add some customisations to both the Dashboard. The customisable options include:
-
Shortening the length of the Link URL, by reducing the amount of characters in the URL (for conciseness and improved visibility).
-
Changing the Theme of the Dashboard/Panel to either Dark or Light.
-
Locking in the selected time range from the Time/Date Range Filter.
-
-
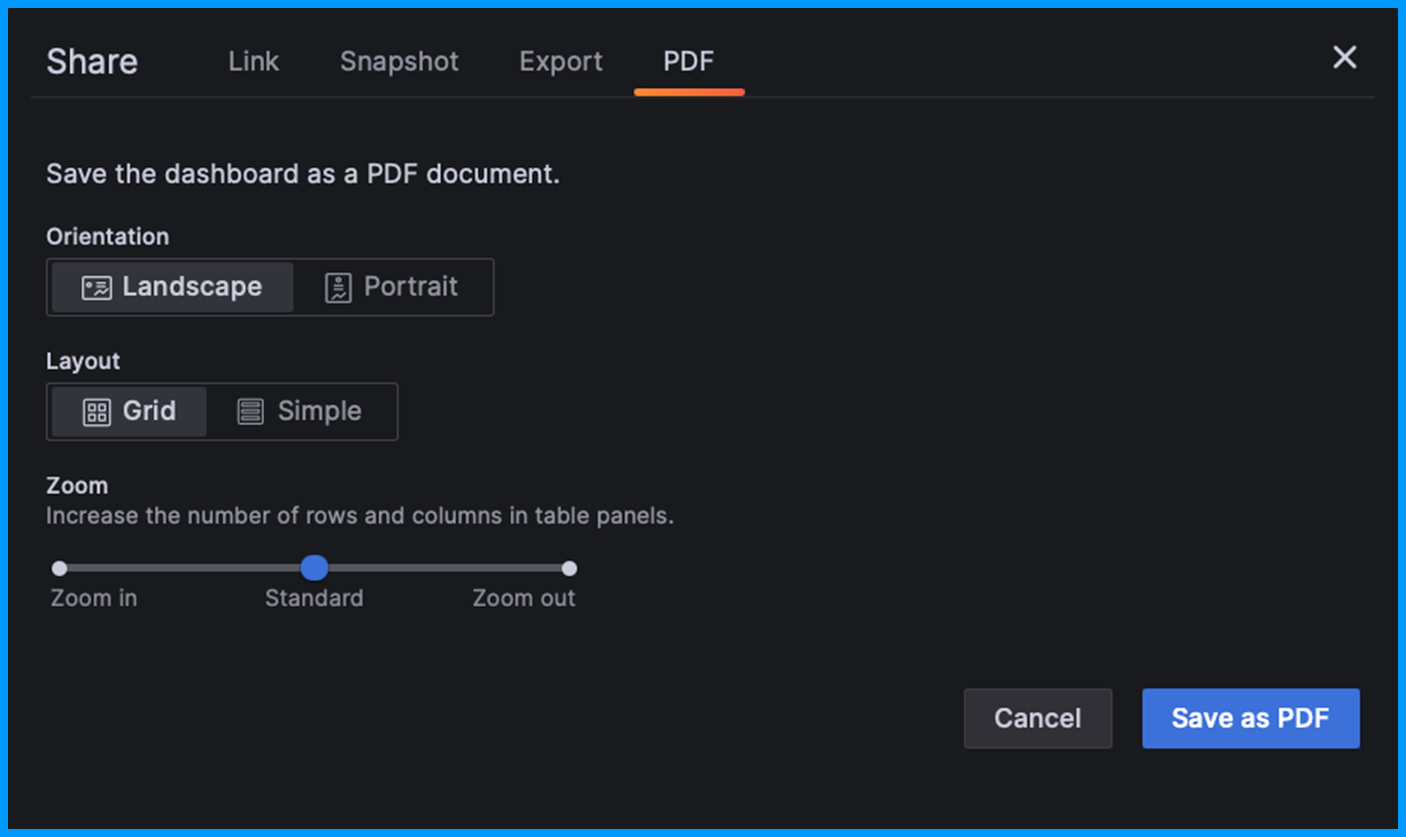
The PDF Section offers the option to present your Dashboard as a PDF document.
-
Alter the layout of the Dashboard to be presented in either Landscape or Portrait orientation, include a Grid layout, or zoom in or out of the Dashboard to change the amount of content displayed in the table Panels.
